Apply a function to every specified column in a data.table and update by reference
Asked Answered
C

7

106

I have a data.table with which I'd like to perform the same operation on certain columns. The names of these columns are given in a character vector. In this particular example, I'd like to multiply all of these columns by -1.

Some toy data and a vector specifying relevant columns:

library(data.table)
dt <- data.table(a = 1:3, b = 1:3, d = 1:3)
cols <- c("a", "b")

Right now I'm doing it this way, looping over the character vector:

for (col in 1:length(cols)) {
   dt[ , eval(parse(text = paste0(cols[col], ":=-1*", cols[col])))]
}

Is there a way to do this directly without the for loop?

Cotemporary answered 30/5, 2013 at 21:44 Comment(0)
T
180

This seems to work:

dt[ , (cols) := lapply(.SD, "*", -1), .SDcols = cols]

The result is

    a  b d
1: -1 -1 1
2: -2 -2 2
3: -3 -3 3

There are a few tricks here:

  • Because there are parentheses in (cols) :=, the result is assigned to the columns specified in cols, instead of to some new variable named "cols".
  • .SDcols tells the call that we're only looking at those columns, and allows us to use .SD, the Subset of the Data associated with those columns.
  • lapply(.SD, ...) operates on .SD, which is a list of columns (like all data.frames and data.tables). lapply returns a list, so in the end j looks like cols := list(...).

EDIT: Here's another way that is probably faster, as @Arun mentioned:

for (j in cols) set(dt, j = j, value = -dt[[j]])
Tachygraphy answered 30/5, 2013 at 21:59 Comment(15)
another way is to use set with a for-loop. I suspect it'll be faster.Jett
@Jett I've made an edit. Is that what you meant? I haven't used set before.Tachygraphy
@Frank, Very much! It avoids .SD creation. Even though, for this particular operation, .SD shouldn't cost much as it's not created for every by. But still, I prefer set for this question.Jett
+1 Great answer. Yes I prefer a for loop with set for cases like this, too.Vitrification
Yes, using set() seems faster, ~4 times faster for my dataset! Amazing.Napper
Here is a variant without .SD, but I don't think it is as good as @Tachygraphy 's answer: dt[, (cols) := lapply(dt[, cols, with = F], "*", -1)]Benefit
Thanks, @JamesHirschorn . I'm not sure, but I suspect there's more overhead to subsetting columns that way rather than using .SD, which is the standard idiom anyway, appearing in the intro vignette github.com/Rdatatable/data.table/wiki/Getting-started Part of the reason for the idiom, I think, is to avoid typing the table name twice.Tachygraphy
does the set for version work with the by= argument?Devitt
@PeterPan No. It's just a utility to do simple operations very quickly.Tachygraphy
@Tachygraphy thanks. I'm also not able to adapt the first code to a case with the by argument and followed up here: #43212128Devitt
@Jett can one use the set syntax if one did not want to replace the columns but rather add columns? For instance say you wanted to add columns whose names were cols.yes.no = paste0(cols,".yn")Blastula
@Blastula It seems to work: d = data.table(x = 1:2); set(d, j="x2", v = 3:4); dTachygraphy
@Tachygraphy yes, indeed j ="x2" might work but Arun's syntax was marching through a list of column names. j was each step. So each column had a different name. Would it have to be j=paste0(j,".yn". I think I tried that and it did not work.Blastula
@Farrel, not entirely sure I follow.. but something like this? d <- data.table(a=1, b=2, c=3); set(d, j=c("d", "e", "f"), value=lapply(d, `*`, 2))?Jett
Warning: The method using .SDcols can unintentionally switch the order of your columns if you use the get() function within lapply(). See an example here: #50878799.Trabue
K
23

I would like to add an answer, when you would like to change the name of the columns as well. This comes in quite handy if you want to calculate the logarithm of multiple columns, which is often the case in empirical work.

cols <- c("a", "b")
out_cols = paste("log", cols, sep = ".")
dt[, c(out_cols) := lapply(.SD, function(x){log(x = x, base = exp(1))}), .SDcols = cols]
Kristinakristine answered 30/3, 2017 at 8:16 Comment(4)
Is there a way to change the names based on a rule? In dplyr, for example, you can do iris %>% mutate_at(vars(matches("Sepal")), list(times_two = ~.*2)) and it will append "_times_two" to the new names.Milliner
I don't think that's possible, but not really sure about it.Kristinakristine
this would add columns with the names of out_cols, while still leaving cols in place. So, you'd need to eliminate those by either explicitly 1) asking for only log.a and log.b: chain a [,.(outcols)] to the end and re-store to dt via <-. 2) remove the old columns with a chained [,c(cols):=NULL]. A non-chaining solution 3) isdt[,c(cols):=...] followed by setnames(dt, cols, newcols)Camelopardus
@mpag, yes that's true, but for my use case of empirical research I most of the time need both series in the data set.Kristinakristine
V
13

UPDATE: Following is a neat way to do it without for loop

dt[,(cols):= - dt[,..cols]]

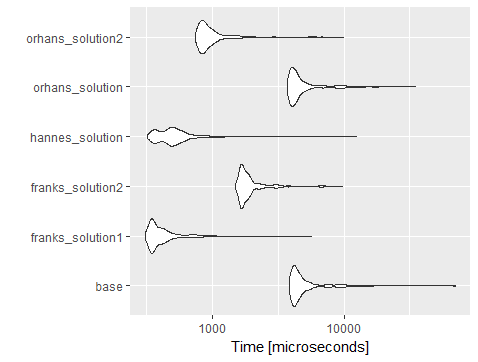
It is a neat way for easy code readability. But as for performance it stays behind Frank's solution according to below microbenchmark result

mbm = microbenchmark(
  base = for (col in 1:length(cols)) {
    dt[ , eval(parse(text = paste0(cols[col], ":=-1*", cols[col])))]
  },
  franks_solution1 = dt[ , (cols) := lapply(.SD, "*", -1), .SDcols = cols],
  franks_solution2 =  for (j in cols) set(dt, j = j, value = -dt[[j]]),
  hannes_solution = dt[, c(out_cols) := lapply(.SD, function(x){log(x = x, base = exp(1))}), .SDcols = cols],
  orhans_solution = for (j in cols) dt[,(j):= -1 * dt[,  ..j]],
  orhans_solution2 = dt[,(cols):= - dt[,..cols]],
  times=1000
)
mbm

Unit: microseconds
expr                  min        lq      mean    median       uq       max neval
base_solution    3874.048 4184.4070 5205.8782 4452.5090 5127.586 69641.789  1000  
franks_solution1  313.846  349.1285  448.4770  379.8970  447.384  5654.149  1000    
franks_solution2 1500.306 1667.6910 2041.6134 1774.3580 1961.229  9723.070  1000    
hannes_solution   326.154  405.5385  561.8263  495.1795  576.000 12432.400  1000
orhans_solution  3747.690 4008.8175 5029.8333 4299.4840 4933.739 35025.202  1000  
orhans_solution2  752.000  831.5900 1061.6974  897.6405 1026.872  9913.018  1000

as shown in below chart

performance_comparison_chart

My Previous Answer: The following also works

for (j in cols)
  dt[,(j):= -1 * dt[,  ..j]]
Verniavernice answered 2/4, 2018 at 12:57 Comment(9)
This is essentially the same thing as Frank's answer from a year and a half ago.Cotemporary
Thanks, Frank's answer was using set. When I work with large data.table's with millions of rows, I see := operator outperforms functionsVerniavernice
I'm skeptical, if you look at the comments of Frank's answer you'll see the creators of data table say set is better and others find it performs better. I wouldn't give you a hard time about except this question is a year and a half old.Cotemporary
The reason I added an answer to an old question is as follows: I also had a similar issue, I came across this post with google search. Afterwards I found a solution to my issue, and I see it applies to here as well. Actually my suggestion uses a new function of data.table that is available in new versions of the library, which did not exist in the time of the question. I thought it is a good idea to share, thinking others with similar problem will end up here with google search.Verniavernice
The main difference in my suggestion is that it uses ..j notion which must be a newer option of data.tableVerniavernice
Are you benchmarking with dt consisting of 3 rows?Garzon
Yes. I also tried 100 and 1000 rows, sequence didn't change.Verniavernice
any benchmark with timings in microseconds is suspect. see the vignette: cran.r-project.org/web/packages/data.table/vignettes/…Heed
Hannes' answer is doing a different computation and so shouldn't be compared with the others, right?Tachygraphy
H
2

None of above solutions seems to work with calculation by group. Following is the best I got:

for(col in cols)
{
    DT[, (col) := scale(.SD[[col]], center = TRUE, scale = TRUE), g]
}
Heimer answered 19/11, 2018 at 18:43 Comment(0)
M
2

dplyr functions work on data.tables, so here's a dplyr solution that also "avoids the for-loop" :)

dt %>% mutate(across(all_of(cols), ~ -1 * .))

I benchmarked it using orhan's code (adding rows and columns) and you'll see dplyr::mutate with across mostly executes faster than most of the other solutions and slower than the data.table solution using lapply.

library(data.table); library(dplyr)
dt <- data.table(a = 1:100000, b = 1:100000, d = 1:100000) %>% 
  mutate(a2 = a, a3 = a, a4 = a, a5 = a, a6 = a)
cols <- c("a", "b", "a2", "a3", "a4", "a5", "a6")

dt %>% mutate(across(all_of(cols), ~ -1 * .))
#>               a       b      d      a2      a3      a4      a5      a6
#>      1:      -1      -1      1      -1      -1      -1      -1      -1
#>      2:      -2      -2      2      -2      -2      -2      -2      -2
#>      3:      -3      -3      3      -3      -3      -3      -3      -3
#>      4:      -4      -4      4      -4      -4      -4      -4      -4
#>      5:      -5      -5      5      -5      -5      -5      -5      -5
#>     ---                                                               
#>  99996:  -99996  -99996  99996  -99996  -99996  -99996  -99996  -99996
#>  99997:  -99997  -99997  99997  -99997  -99997  -99997  -99997  -99997
#>  99998:  -99998  -99998  99998  -99998  -99998  -99998  -99998  -99998
#>  99999:  -99999  -99999  99999  -99999  -99999  -99999  -99999  -99999
#> 100000: -100000 -100000 100000 -100000 -100000 -100000 -100000 -100000

library(microbenchmark)
mbm = microbenchmark(
  base_with_forloop = for (col in 1:length(cols)) {
    dt[ , eval(parse(text = paste0(cols[col], ":=-1*", cols[col])))]
  },
  franks_soln1_w_lapply = dt[ , (cols) := lapply(.SD, "*", -1), .SDcols = cols],
  franks_soln2_w_forloop =  for (j in cols) set(dt, j = j, value = -dt[[j]]),
  orhans_soln_w_forloop = for (j in cols) dt[,(j):= -1 * dt[,  ..j]],
  orhans_soln2 = dt[,(cols):= - dt[,..cols]],
  dplyr_soln = (dt %>% mutate(across(all_of(cols), ~ -1 * .))),
  times=1000
)

library(ggplot2)
ggplot(mbm) +
  geom_violin(aes(x = expr, y = time)) +
  coord_flip()

Created on 2020-10-16 by the reprex package (v0.3.0)

Maloriemalory answered 16/10, 2020 at 11:25 Comment(0)
S
1

To add example to create new columns based on a string vector of columns. Based on Jfly answer:

dt <- data.table(a = rnorm(1:100), b = rnorm(1:100), c = rnorm(1:100), g = c(rep(1:10, 10)))

col0 <- c("a", "b", "c")
col1 <- paste0("max.", col0)  

for(i in seq_along(col0)) {
  dt[, (col1[i]) := max(get(col0[i])), g]
}

dt[,.N, c("g", col1)]
Sferics answered 4/2, 2019 at 10:29 Comment(0)
T
0
library(data.table)
(dt <- data.table(a = 1:3, b = 1:3, d = 1:3))

Hence:

   a b d
1: 1 1 1
2: 2 2 2
3: 3 3 3

Whereas (dt*(-1)) yields:

    a  b  d
1: -1 -1 -1
2: -2 -2 -2
3: -3 -3 -3
Talca answered 23/1, 2019 at 16:12 Comment(4)
Fyi, the "every specified column" in the title meant that the asker was interested in applying it to a subset of columns (maybe not all of them).Tachygraphy
@Tachygraphy sure! In that case the OP could perform dt[,c("a","b")]*(-1).Talca
Well, let's be complete and say dt[, cols] <- dt[, cols] * (-1)Sententious
seems like the new syntax required is dt[, cols] <- dt[, ..cols] * (-1)Maloriemalory

© 2022 - 2024 — McMap. All rights reserved.