Memory leak in java web application
Asked Answered
B

3

6

I have a web application that uses hibernate 3.6.4 and spring 3.2.4 (mvc,tx and security) and is running in tomcat 7. Each time when I deploy a newer version of my app without restarting tomcat, then the memory used by tomcat increases about 50MB.

I created some heap dumps and analysed them with Eclipse Memory Analyser. I found out that each time when I redeployed the app, a new instance of WebappClassLoader was created. But even after I stopped the application with tomcat manager, the WebappClassLoader remains in memory and is not garbage collected. So after each redeploy an additional WebappClassLoader remains in memory and uses about 50MB of memory.

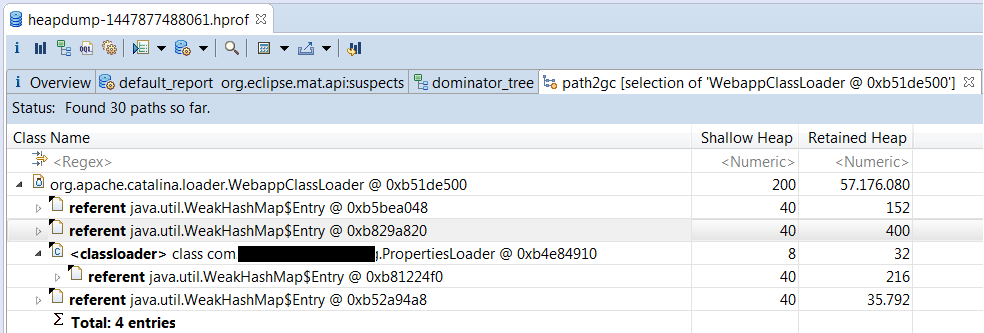
I used the Eclipse Memory Analyser in order to find the reference paths from the WebappClassLoader to the GC roots. In the result I couldn't find any strong references that could prevent the WebappClassLoaders from being garbage collected.

enter image description here

So, what keeps the WebappClassLoaders alive? Where else could I investigate in order to find out, what prevents the WebappClassLoader from the garbage collection?

I thought that there is maybe a blocking finalize() method that prevents the GC from finishing the garbage collection. But how could I check this?

Bandwidth answered 18/11, 2015 at 20:30 Comment(2)
Are you using org.apache.catalina.core.JreMemoryLeakPreventionListener in tomcat7Disciplinarian
@Disciplinarian Yes I do. As far as I understand is the JreMemoryLeakPreventionListener enabled by default in tomcat 7. The default server.xml contains the following entry: <!-- Prevent memory leaks due to use of particular java/javax APIs--> <Listener className="org.apache.catalina.core.JreMemoryLeakPreventionListener" /> Bandwidth
T
6

Class loaders are in theory garbage collected when there is not reference to the object instances and class unloading is not necessary, but in practice it seems like to be more problematic.

I would recommend to read this two articles

http://frankkieviet.blogspot.com.au/2006/10/classloader-leaks-dreaded-permgen-space.html

http://frankkieviet.blogspot.com.au/2006/10/how-to-fix-dreaded-permgen-space.html

Tuba answered 24/11, 2015 at 16:2 Comment(1)
In the first article is a statement: "... all the profilers that we tried at the time, did not follow links through classloaders" The article was written in 2006. Is it true that the current versions of JProfiler and Eclipse Memory Analyser do (still) not follow references across classloaders?Bandwidth
A
3

You can follow the steps presented in Anatomy of a PermGen Memory Leak tutorial too. They are using Java Visual VM but the steps and the things to check should be the same in Eclipse Memory Analizer too. In this presentation you can find the possible causes of such leaks.

Also note that if you don't see any references to WebappClassLoaders it could be that the JVM has plenty of PermGen and is postponing the eviction. You could easily check this by running with a smaller PermGen size and do a couple of redeploys.

Algae answered 29/11, 2015 at 8:56 Comment(0)
C
0

I'm not expert in Tomcat and it's re-deployment implementation, but back in the days when we used JBoss, we had quite similar situation. It was due to the fact that PermGen space is not garbage-collected, and every new deployment puts classes in there. So if you are not on Java 8, check if the actual "leak" is not in the permgen space.

Civvies answered 27/11, 2015 at 11:31 Comment(0)

© 2022 - 2024 — McMap. All rights reserved.