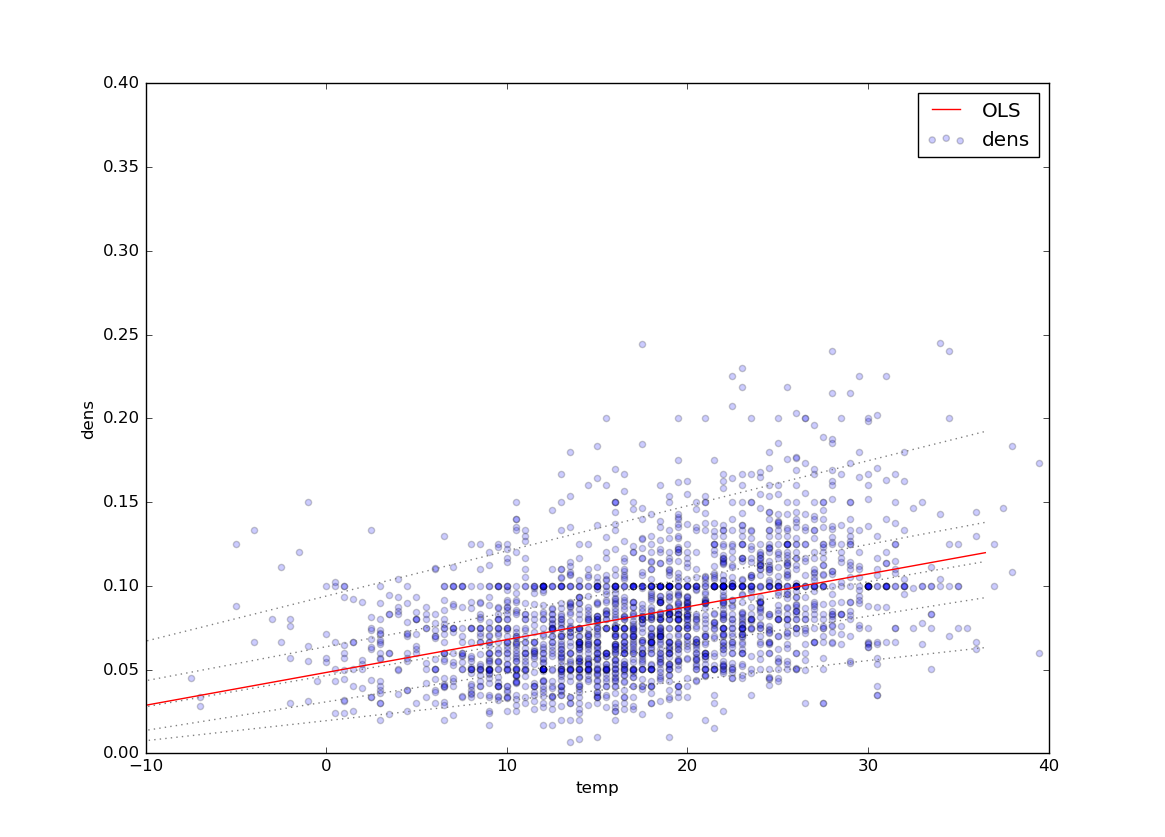
I am following the StatsModels example here to plot quantile regression lines. With only slight modification for my data, the example works great, producing this plot (note that I have modified the code to only plot the 0.05, 0.25, 0.5, 0.75, and 0.95 quantiles) :

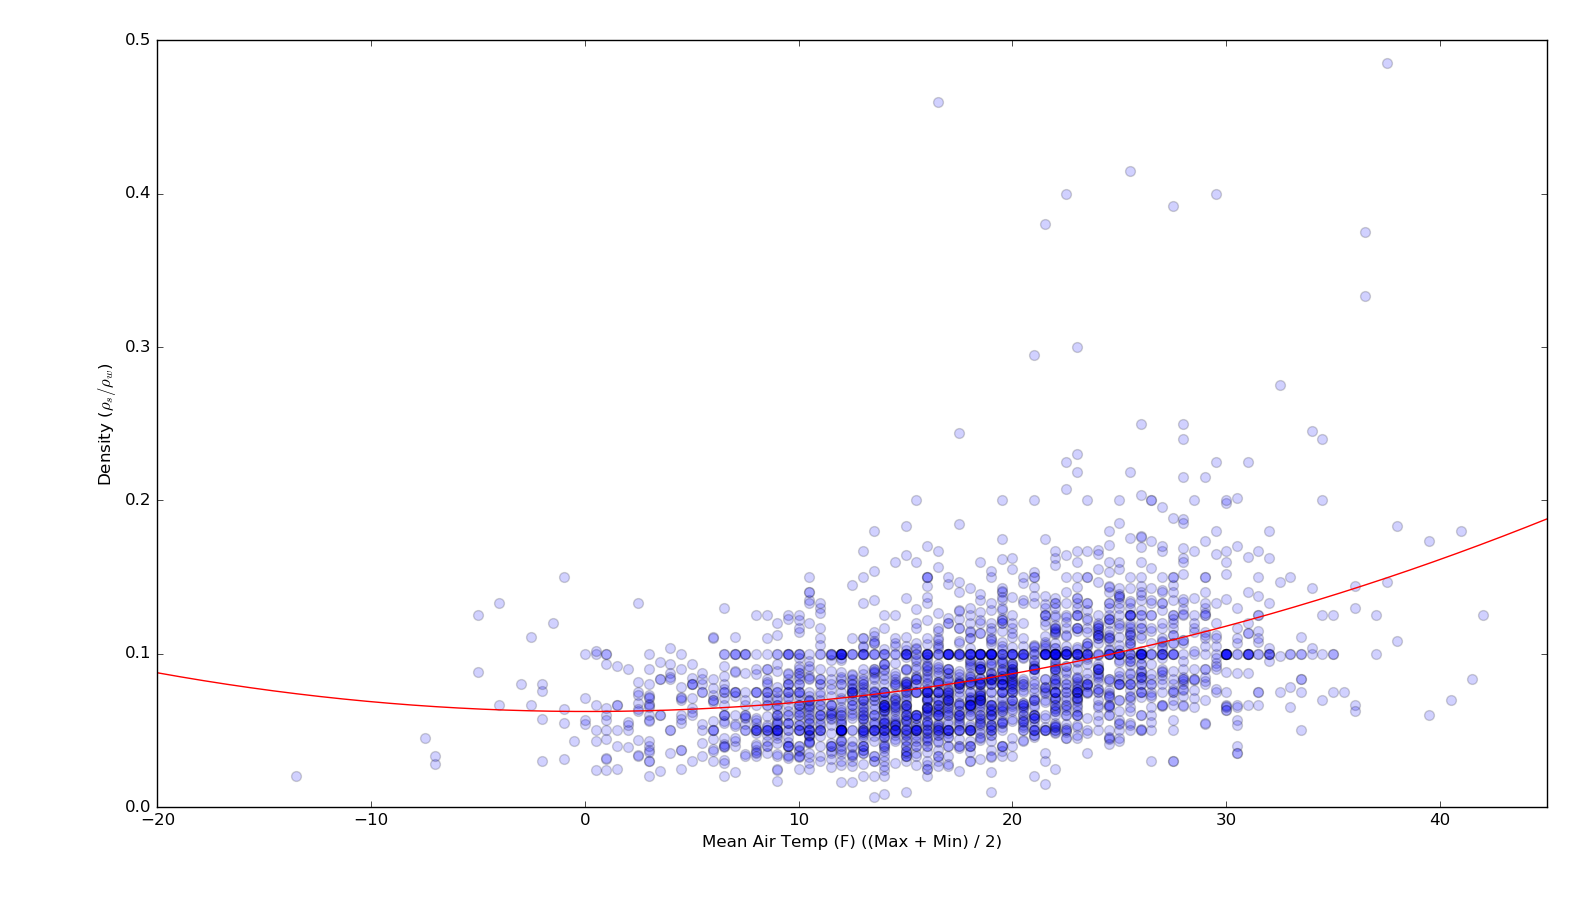
However, I would like to plot the OLS fit and corresponding quantiles for a 2nd order polynomial fit (instead of linear). For example, here is the 2nd-order OLS line for the same data:

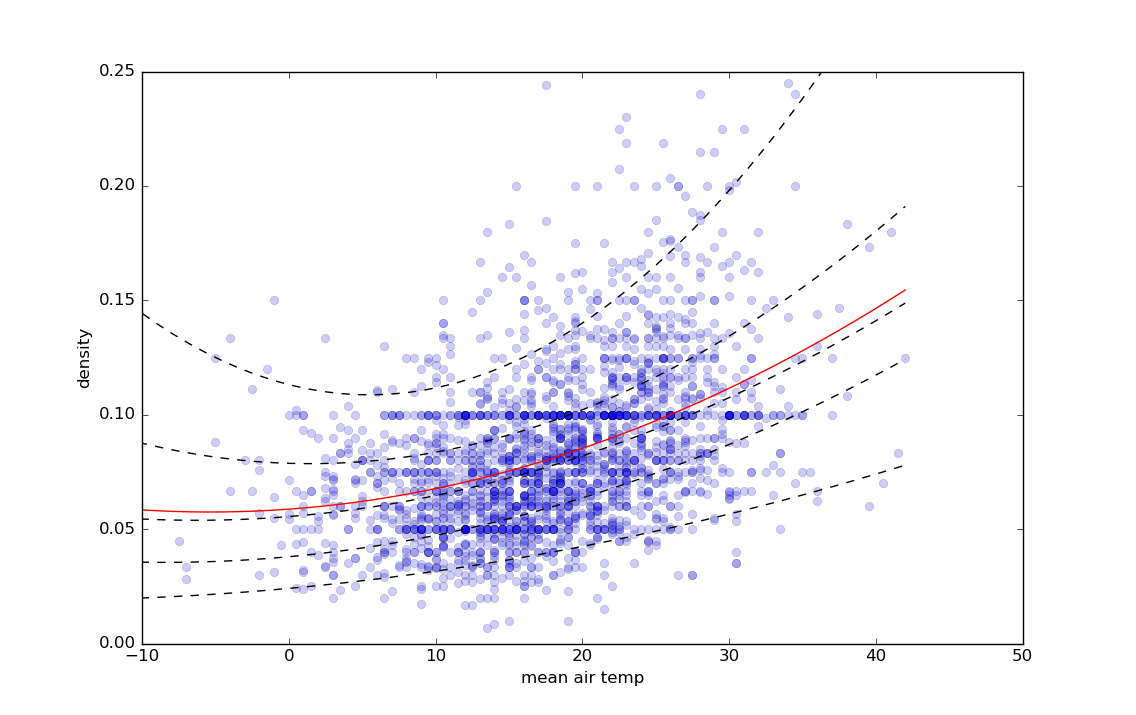
How can I modify the code in the linked example to produce non-linear quantiles?
Here is my relevant code modified from the linked example to produce the 1st plot:
d = {'temp': x, 'dens': y}
df = pd.DataFrame(data=d)

# Least Absolute Deviation
#
# The LAD model is a special case of quantile regression where q=0.5

mod = smf.quantreg('dens ~ temp', df)
res = mod.fit(q=.5)
print(res.summary())

# Prepare data for plotting
#
# For convenience, we place the quantile regression results in a Pandas DataFrame, and the OLS results in a dictionary.

quantiles = [.05, .25, .50, .75, .95]
def fit_model(q):
    res = mod.fit(q=q)
    return [q, res.params['Intercept'], res.params['temp']] + res.conf_int().ix['temp'].tolist()

models = [fit_model(x) for x in quantiles]
models = pd.DataFrame(models, columns=['q', 'a', 'b','lb','ub'])

ols = smf.ols('dens ~ temp', df).fit()
ols_ci = ols.conf_int().ix['temp'].tolist()
ols = dict(a = ols.params['Intercept'],
           b = ols.params['temp'],
           lb = ols_ci[0],
           ub = ols_ci[1])

print(models)
print(ols)

x = np.arange(df.temp.min(), df.temp.max(), 50)
get_y = lambda a, b: a + b * x

for i in range(models.shape[0]):
    y = get_y(models.a[i], models.b[i])
    plt.plot(x, y, linestyle='dotted', color='grey')

y = get_y(ols['a'], ols['b'])
plt.plot(x, y, color='red', label='OLS')

plt.scatter(df.temp, df.dens, alpha=.2)
plt.xlim((-10, 40))
plt.ylim((0, 0.4))
plt.legend()
plt.xlabel('temp')
plt.ylabel('dens')
plt.show()


'dens ~ temp + I(temp ** 2.0)'– Eberhard