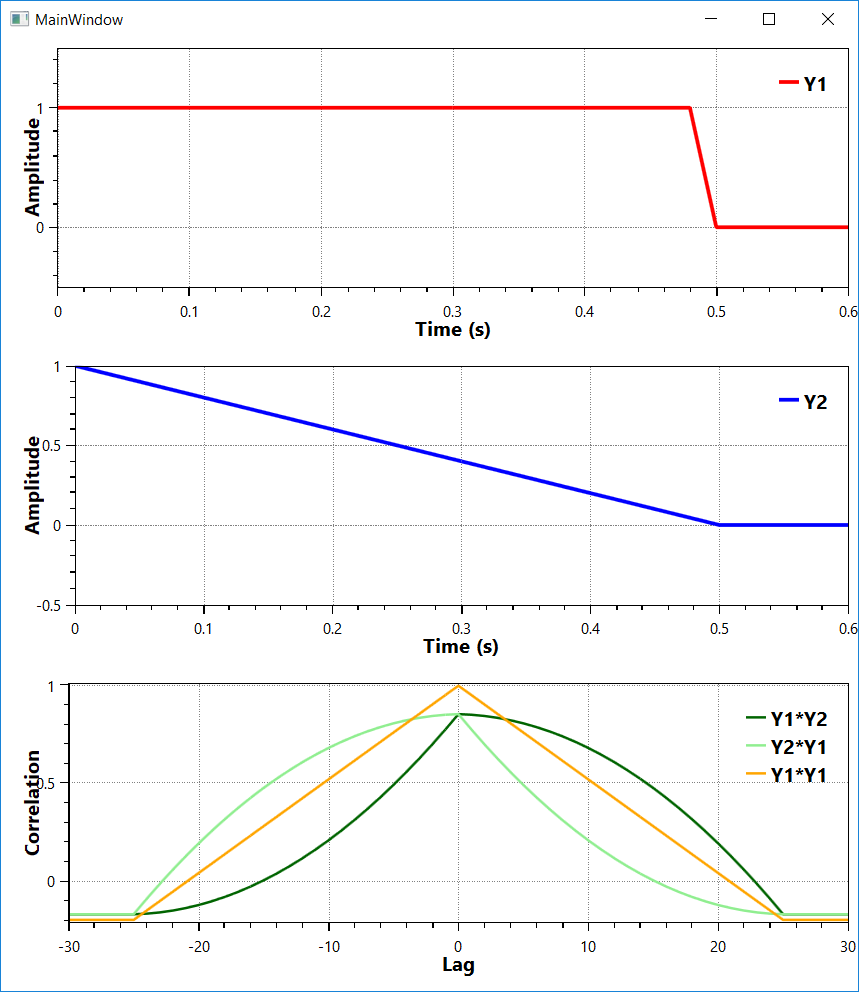
Correlation can be calculated by any of the methods from MathNet.Numerics.Statistics.Correlation, like Pearson or Spearman. But if you're looking for results like the ones provided by Matlab's xcorr or autocorr, then you have to manually calculate the correlation using those methods for each lag/delay value between your input samples. Notice this example includes both, cross and auto correlation.
![enter image description here]()
double fs = 50; //sampling rate, Hz
double te = 1; //end time, seconds
int size = (int)(fs * te); //sample size

var t = Enumerable.Range(0, size).Select(p => p / fs).ToArray();
var y1 = t.Select(p => p < te / 2 ? 1.0 : 0).ToArray();
var y2 = t.Select(p => p < te / 2 ? 1.0 - 2*p : 0).ToArray();

var r12 = StatsHelper.CrossCorrelation(y1, y2); // Y1 * Y2
var r21 = StatsHelper.CrossCorrelation(y2, y1); // Y2 * Y1
var r11 = StatsHelper.CrossCorrelation(y1, y1); // Y1 * Y1 autocorrelation
StatsHelper:
public static class StatsHelper
{
    public static LagCorr CrossCorrelation(double[] x1, double[] x2)
    {
        if (x1.Length != x2.Length)
            throw new Exception("Samples must have same size.");

        var len = x1.Length;
        var len2 = 2 * len;
        var len3 = 3 * len;
        var s1 = new double[len3];
        var s2 = new double[len3];
        var cor = new double[len2];
        var lag = new double[len2];

        Array.Copy(x1, 0, s1, len, len);
        Array.Copy(x2, 0, s2, 0, len);

        for (int i = 0; i < len2; i++)
        {
            cor[i] = Correlation.Pearson(s1, s2);
            lag[i] = i - len;
            Array.Copy(s2,0,s2,1,s2.Length-1);
            s2[0] = 0;
        }

        return new LagCorr { Corr = cor, Lag = lag };
    }
}
LagCorr:
public class LagCorr
{
    public double[] Lag { get; set; }
    public double[] Corr { get; set; }
}
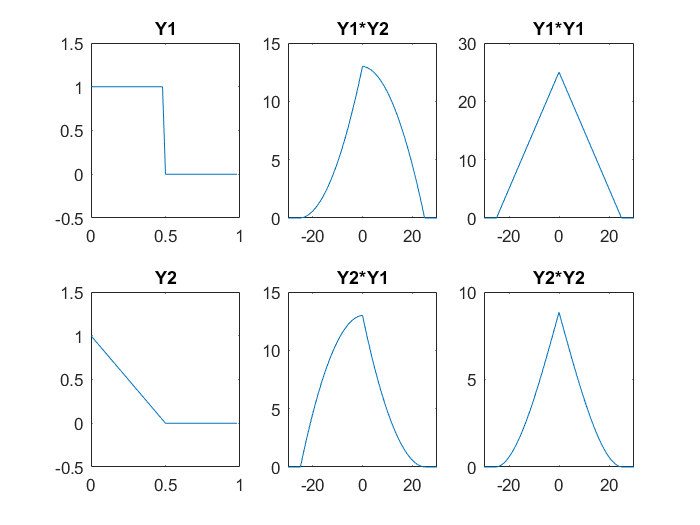
EDIT: Adding Matlab comparison results:
clear;
step=0.02;
t=[0:step:1-step];
y1=ones(1,50);
y1(26:50)=0;
y2=[1-2*t];
y2(26:50)=0;

[cor12,lags12]=xcorr(y1,y2);
[cor21,lags21]=xcorr(y2,y1);
[cor11,lags11]=xcorr(y1,y1);
[cor22,lags22]=xcorr(y2,y2);

subplot(2,3,1);
plot(t,y1);
title('Y1');
axis([0 1 -0.5 1.5]);

subplot(2,3,2);
plot(lags12,cor12);
title('Y1*Y2');
axis([-30 30 0 15]);

subplot(2,3,3);
plot(lags11,cor11);
title('Y1*Y1');
axis([-30 30 0 30]);

subplot(2,3,4);
plot(t,y2);
title('Y2');
axis([0 1 -0.5 1.5]);

subplot(2,3,5);
plot(lags21,cor21);
title('Y2*Y1');
axis([-30 30 0 15]);

subplot(2,3,6);
plot(lags22,cor22);
title('Y2*Y2');
axis([-30 30 0 10]);
![enter image description here]()


