I want to plot a world map with multiple points aka combinations of latitude and longitude coordinates.
I don't want to use Mercator, therefore I re-project both, the data for the world map and my coordinates.
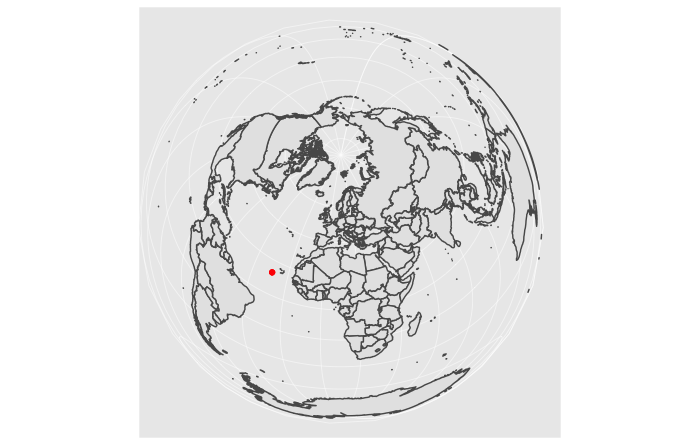
While the projection for the world changes, all points are suddenly placed in the middle of the map (a common behavior, when the projections don't align, see https://www.earthdatascience.org/courses/earth-analytics/spatial-data-r/intro-to-coordinate-reference-systems/).
What am I doing wrong in when assigning the projection to the points?
My code:
library(ggplot2)
library(sf)
library(rnaturalearth)

# assign a projection, for example ...
crs <- 3035

# get data for the world map and assign the projection
world <- ne_countries(scale = "medium", returnclass = "sf")
world <- st_transform(world, crs = crs)

# create data frame with three points, convert it to a spatial object
# and assign the same projection
points <- data.frame(longitude = c(-105.2519, 10.7500, 2.9833),
                     latitude = c(40.0274, 59.9500, 39.6167))

points <-  st_as_sf(points, coords = c("longitude", "latitude"), crs = crs)

# plot the data with ggplot2:
ggplot() +
  geom_sf(data = world) +
  geom_sf(data = points, color = "red")
The result:
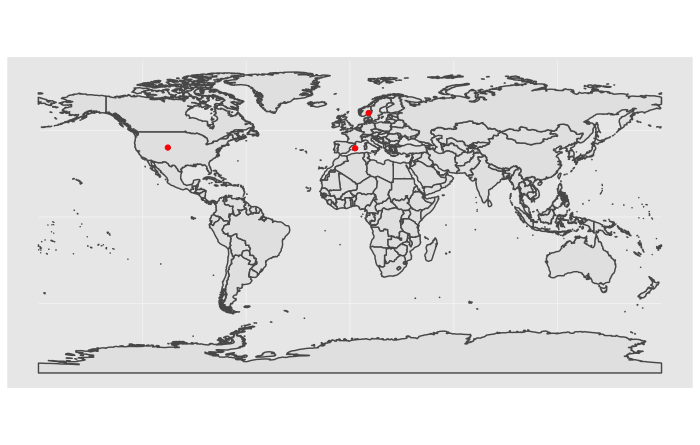
It does work, however, when I use the standard projection WGS84, i.e. crs = 4326):


