Summary
Uploading an image from a Nodejs backend to AWS S3 via JIMP fills up heaps of memory.
Workflow
- Frontend (react) sends image via formsubmission to the API
- The server parses the form data
- JIMP is rotating the image
- JIMP is resizing the image if > 1980px wide
- JIMP creates Buffer
- Buffer is being uploaded to S3
- Promise resolved -> Image meta data (URL, Bucket name, index, etc.) saved in Database (MongoDB)
Background
The Server is hosted on Heroku with only 512MB RAM. Uploading smaller images and all other requests are working fine. However, the app crashes when uploading a single image larger than ~8MB, with only a single user online.
Investigation so far
I've tried to replicate this on my local environment. Since I don't have a memory restriction, the app won't crash but the memory usage is ~870MB when uploading a 10MB image. A 6MB image stays around 60MB RAM usage. I've updated all the npm packages, and have tried to disabled any processing of the image.
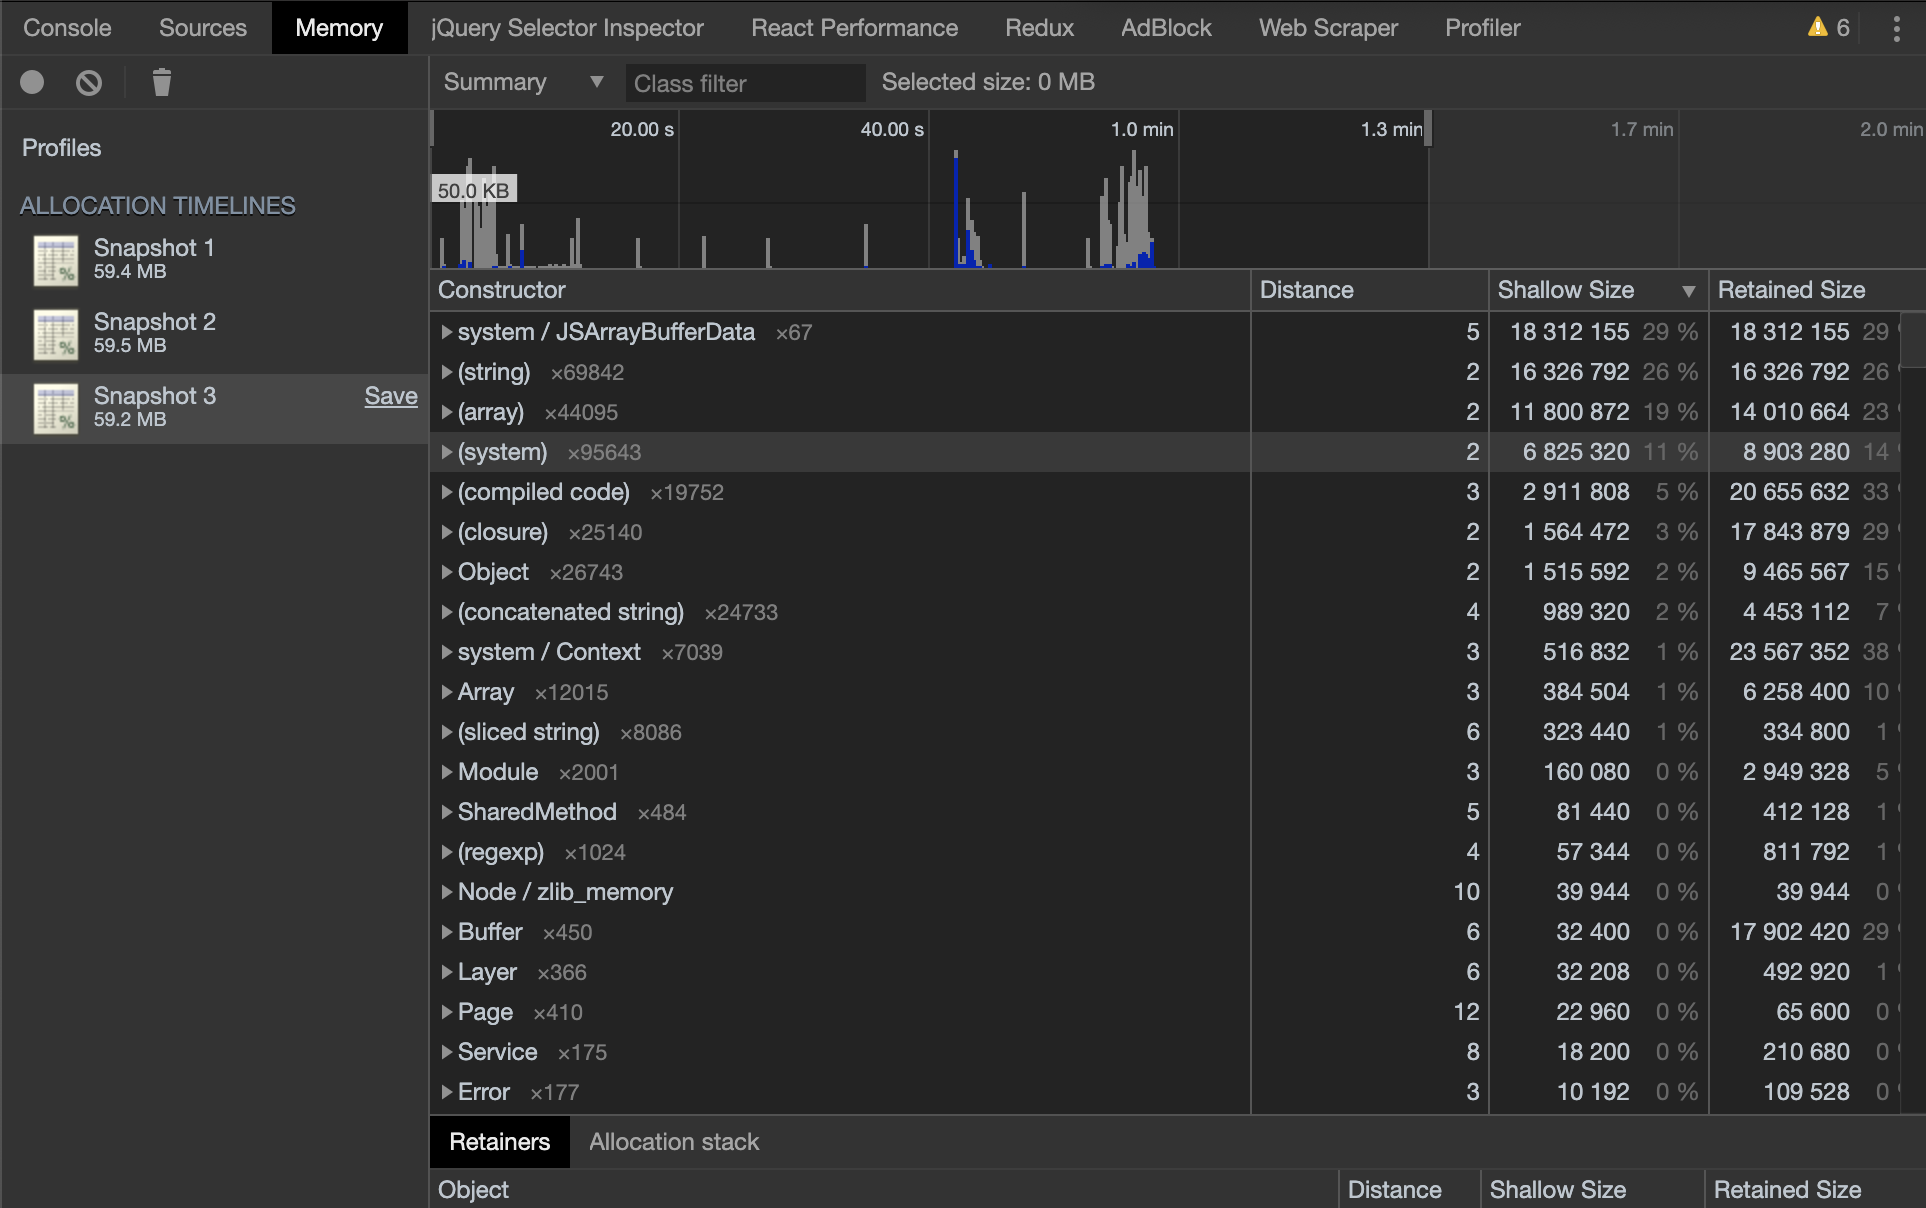
I've tried to look for memory leaks as seen in the following screenshots, however, following the same workflow as above for the same image (6MB) and taking 3 heap snapshots are giving around 60MB RAM usage.
First, I thought the problem is that the image processing (resizing) takes too much memory, but this would not explain the big gap between 60MB (for a 6MB image) and around 800MB for a 10MB image.
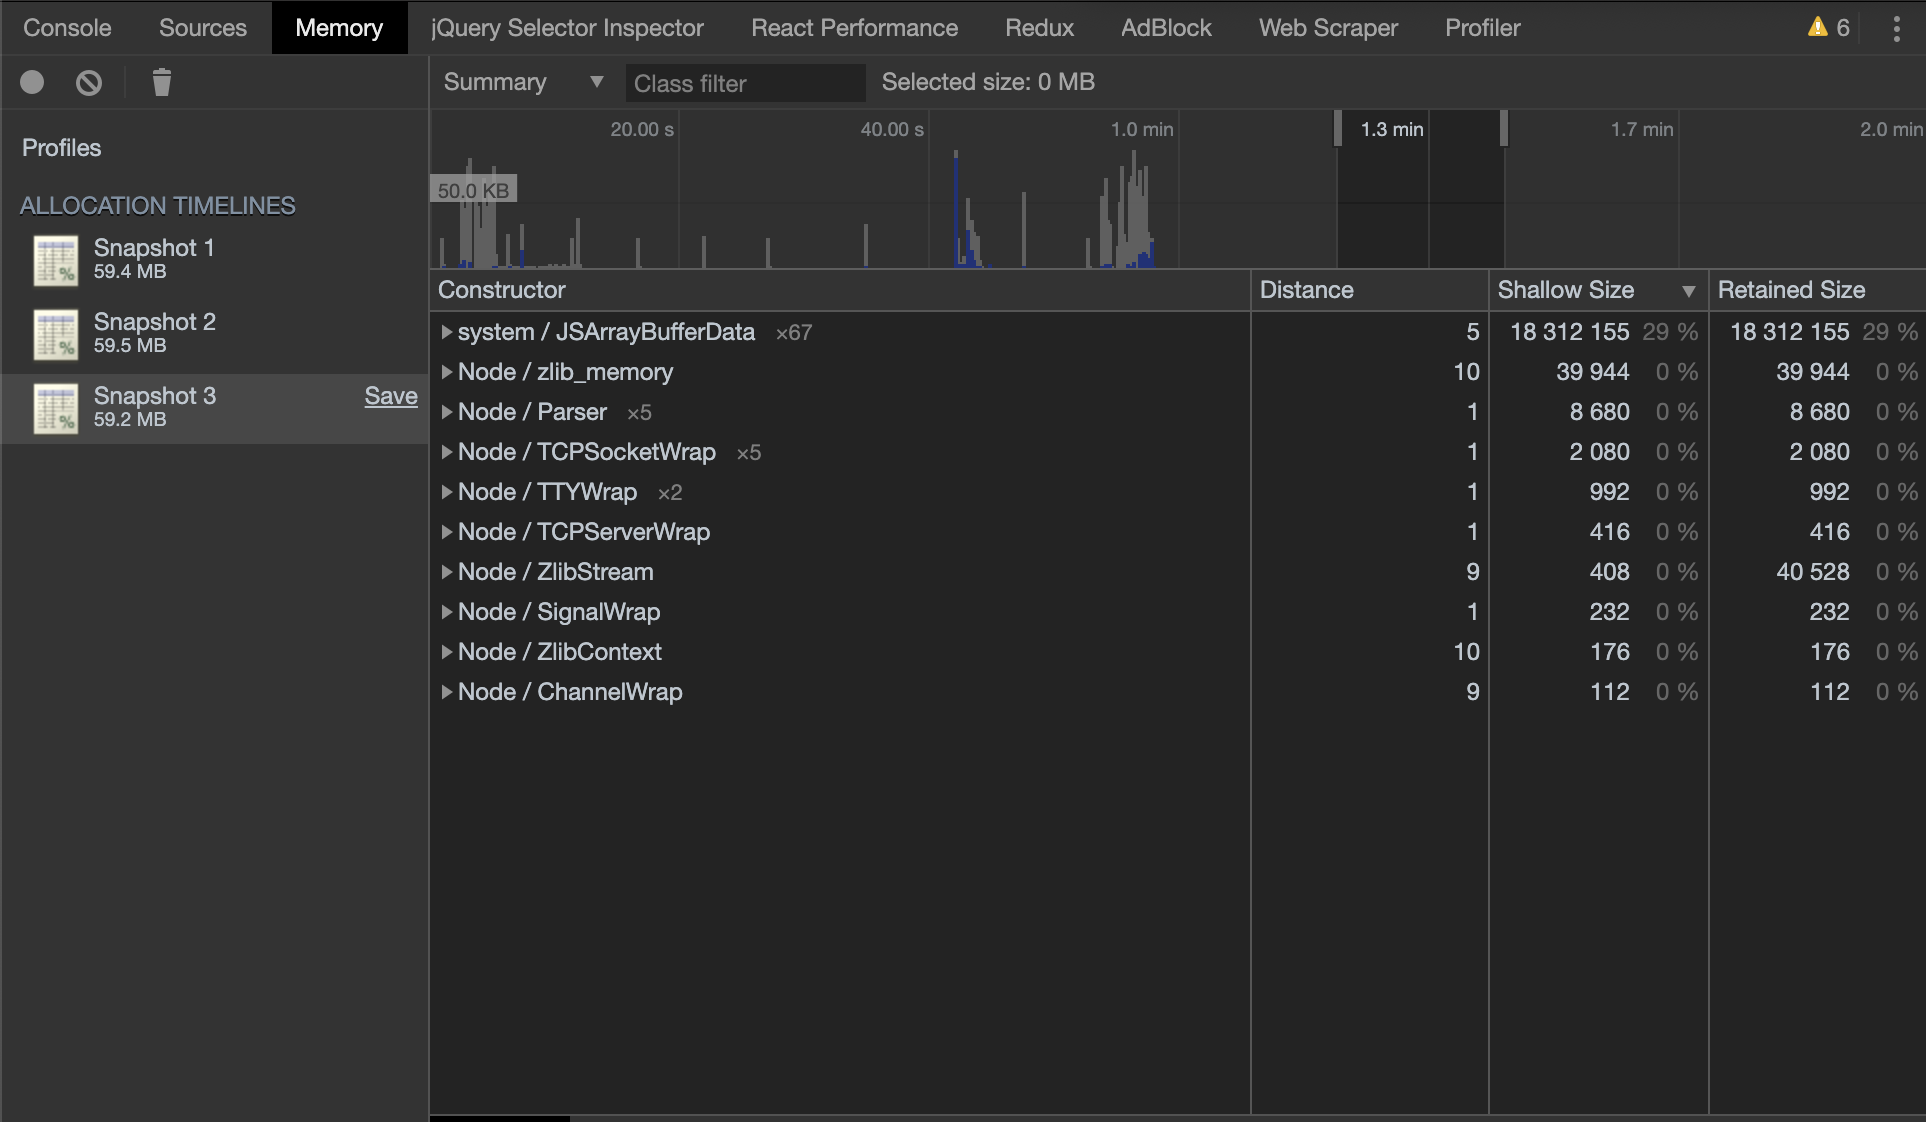
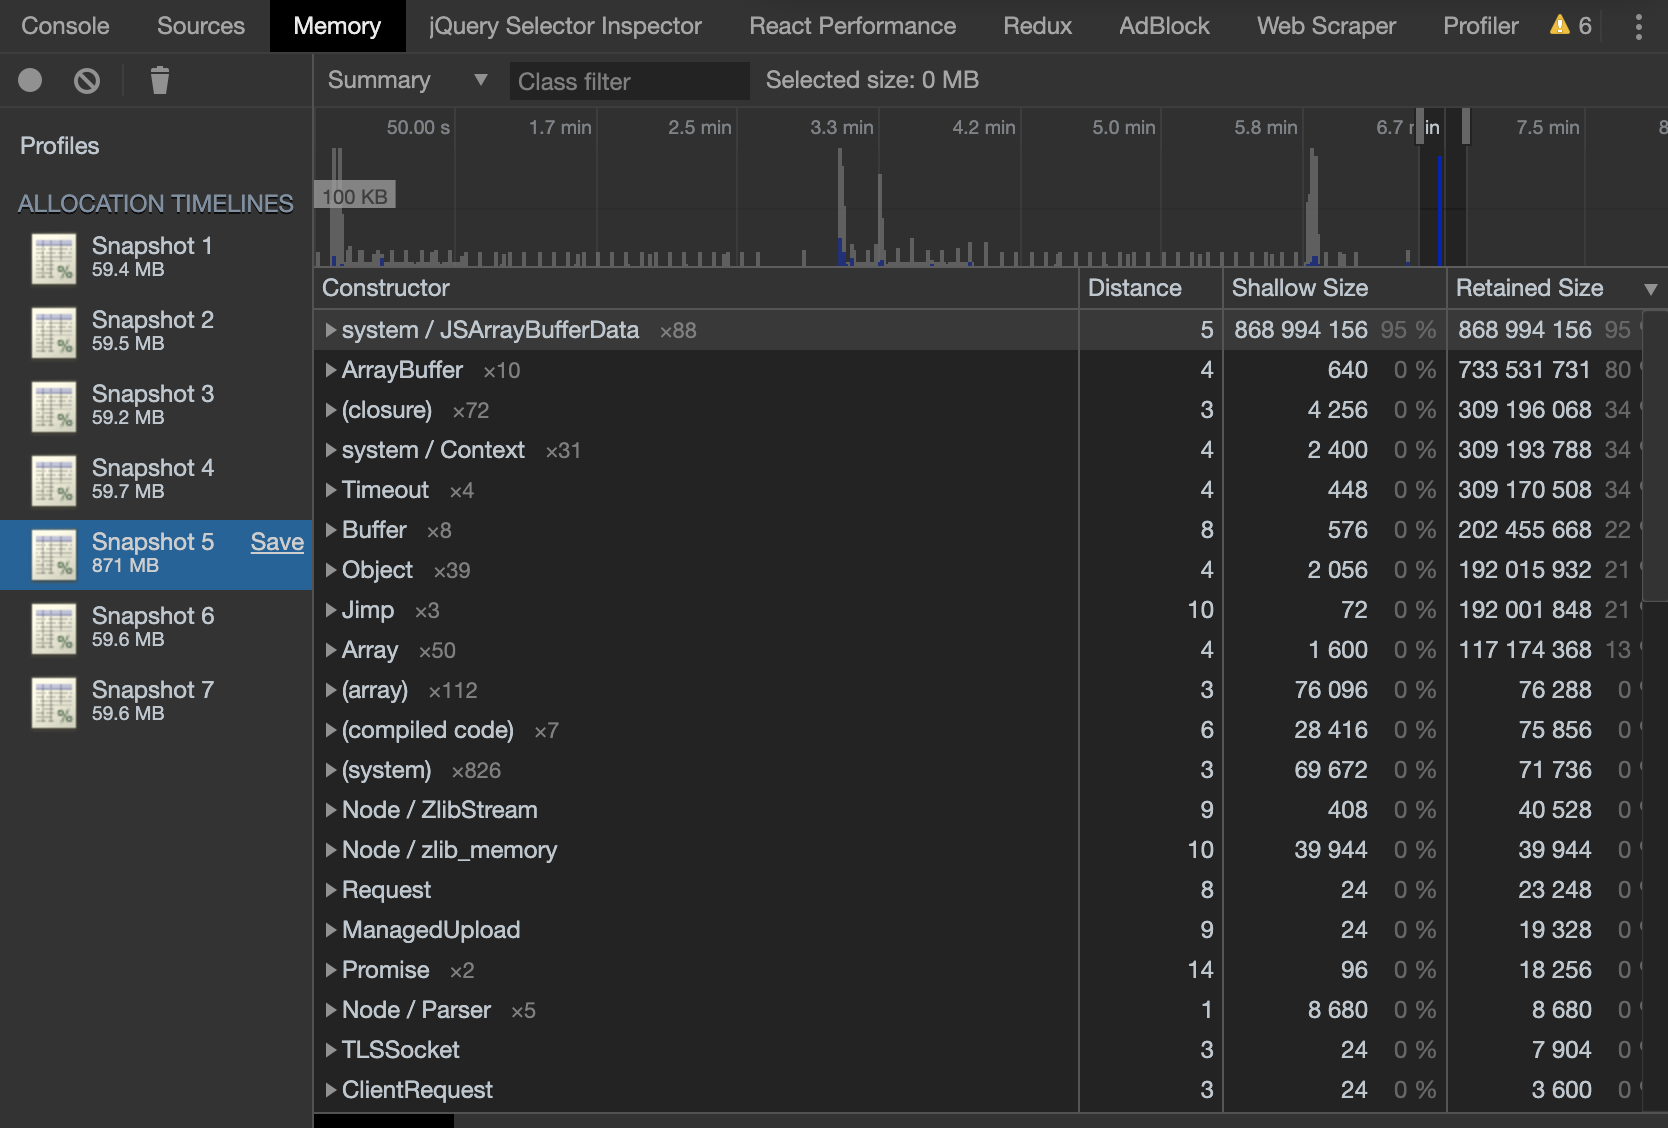
Then I thought it's related to the item "system / JSArrayBufferData" (seen in ref2) which is taking around 30% of the memory. However, this item is always there, even I do not upload an image. It only appears just before I stop the recording snapshot in the "Memory tab" under the "Chrome dev tools". However, I'm still not 100% sure what exactly it is.
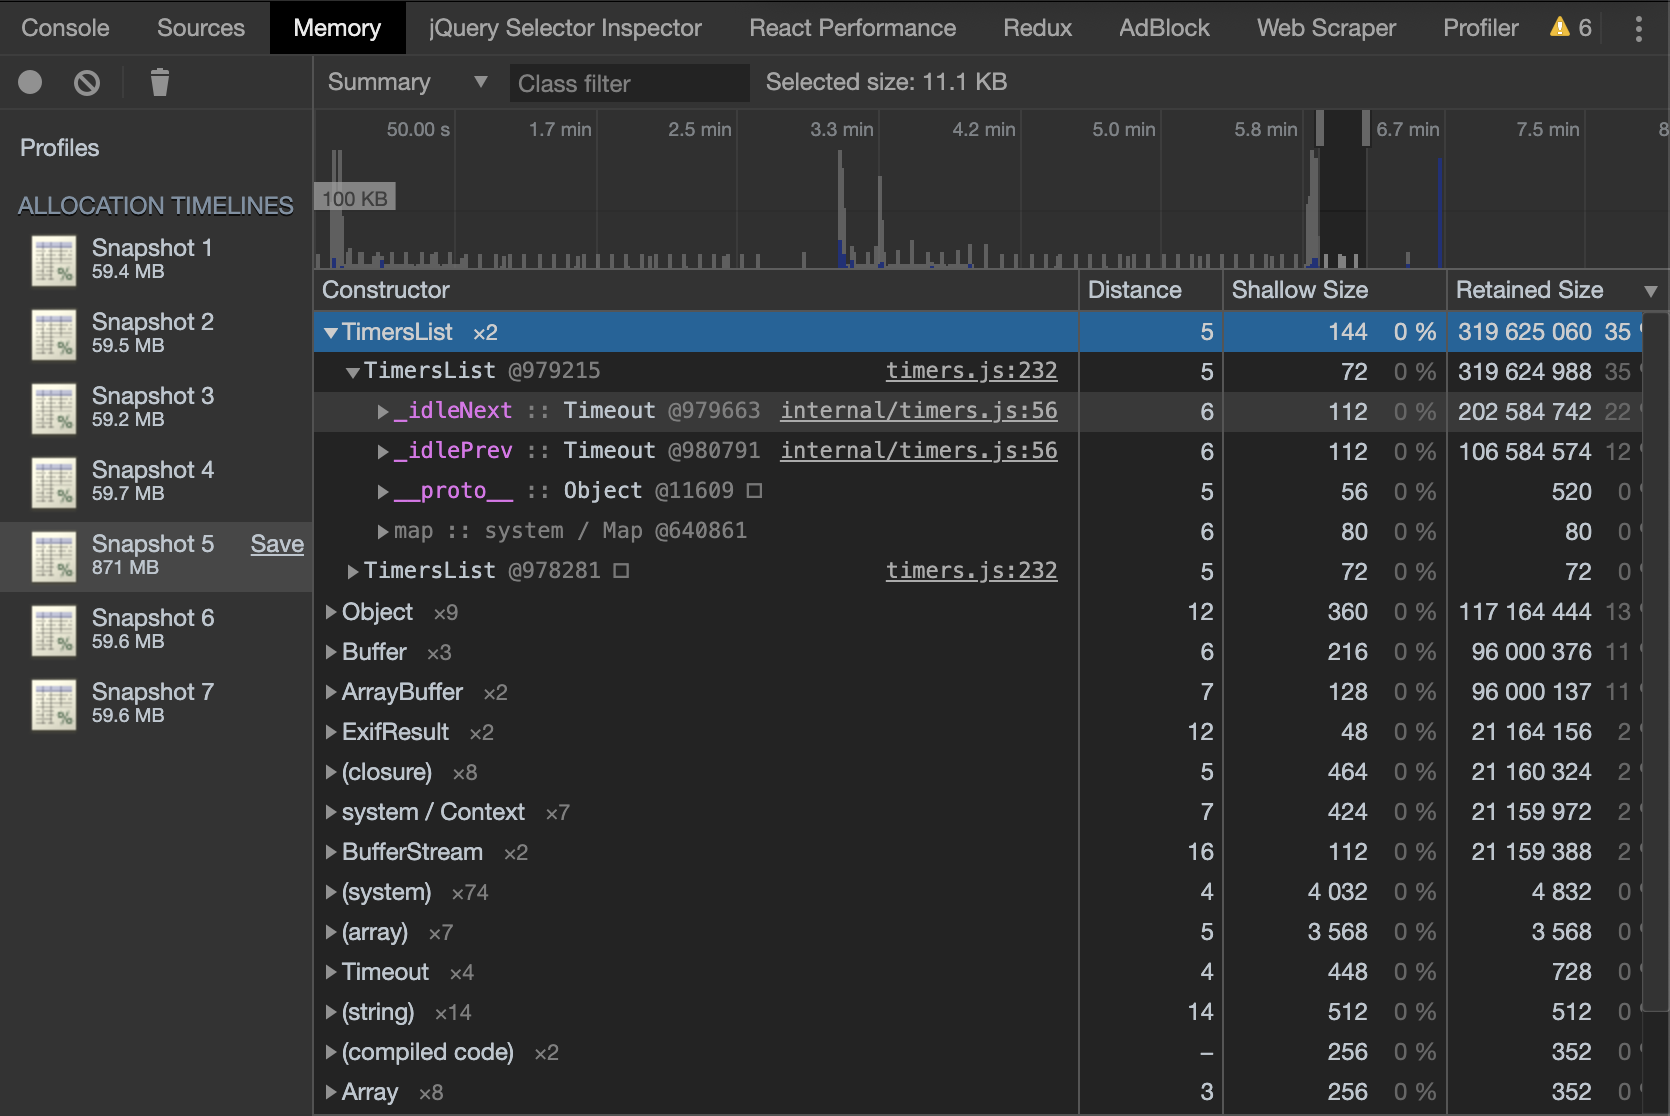
Now, I believe this is related to the "TimeList" (seen in ref3). I think it's coming from timeouts waiting for the file to be uploaded to S3. However, here as well, I'm absolutely not sure why this is happening.
The following are the screenshots of in my opinion important parts of the snapshots of the Chrome Inspector running on the server on nodejs with the --inspect flag.
Ref1: Shows full items of 3rd Snapshot - All of the 3 snapshots have uploaded the same image of 6MB. Garbage seems properly collected as memory size did not increase
 Ref2: Shows the end 3rd Snapshot, just before I stopped recording. Unsure what "system / JSArrayBufferData" is.
 Ref3: Shows the end of the 5th Snapshot, this is the one with a 10MB image. Those little, continuous spikes are the items "TimeList" which seems to be related to a timeout. It seems they appear when the server is waiting for a response from AWS. It also seems this is what's filling up the memory as this item is not there when uploading something less than 10MB.
 Ref4: Shows the immediate end of the 5th Snapshot, just before stopping the recording. "system / JSArrayBufferData" appears again, however, only at the end.
Question
Unfortunately, I'm not sure how to articulate my question as I don't know what the problem is or for what I really need to look out. I would be very appreciative for any tips or experiences.


retained sizesof objects. Objects likeArrayBuffer,Buffer,Jimphave too much retained size ( keeping a lot of objects alive in memory ). Take a look at the reference inside the entries. Also try removing some parts of your pipeline and then upload. – Blankly