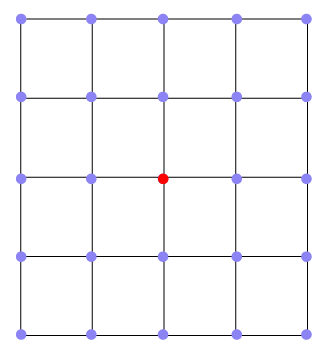
Try this vectorized approach. The equation to offset a lat-long with meters is inspired from this link on stack exchange -
import numpy as np

lat, lon = 50, -10 #center coordinate
dist, coors = 100, 2 #meters, num coordinates in each direction

#Creating the offset grid
mini, maxi = -dist*coors, dist*coors
n_coord = coors*2+1
axis = np.linspace(mini, maxi, n_coord)
X, Y = np.meshgrid(axis, axis)


#avation formulate for offsetting the latlong by offset matrices
R = 6378137 #earth's radius
dLat = X/R
dLon = Y/(R*np.cos(np.pi*lat/180))
latO = lat + dLat * 180/np.pi
lonO = lon + dLon * 180/np.pi

#stack x and y latlongs and get (lat,long) format
output = np.stack([latO, lonO]).transpose(1,2,0)
output.shape
(5,5,2)
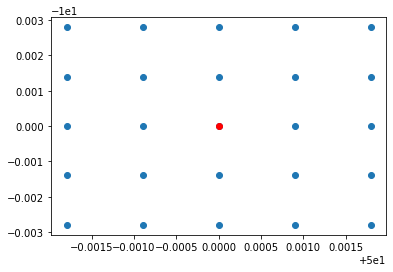
Let's plot to see the grid of points and to confirm that the points are properly distributed around the center lat long.
import matplotlib.pyplot as plt

points = output.reshape(-1,2)
x = points[:,0]
y = points[:,1]

plt.scatter(x,y)              #<- plot all points
plt.scatter(50,-10,color='r') #<- plot the center lat long
![enter image description here]()
EXPLANATION
I break the above steps down into separate functions (and use np.vectorize) for ease of understanding.
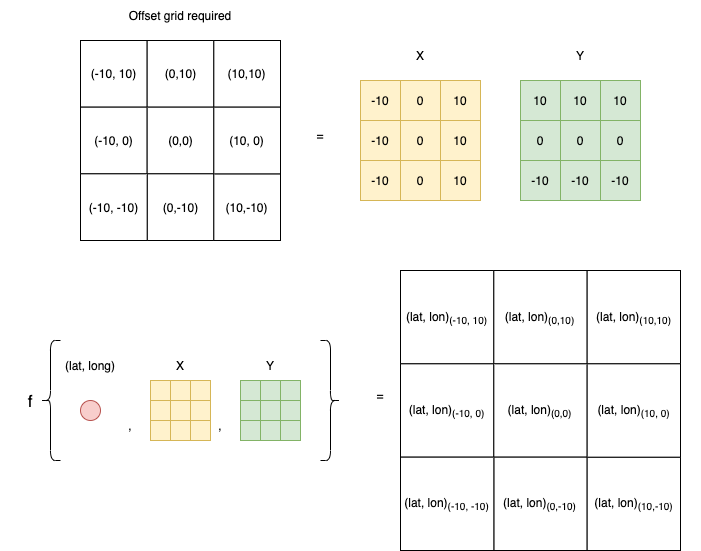
- First you need a vectorized function that takes in (lat, long) and offsets it by meters in both X and Y directions.
- You need to create an
offset_grid
- You can start by using
np.linspace to create a range from start to end with the required number of points
- Next, you can use this to create a grid with X, Y matrices, using
np.meshgrid
- With the vectorized function and the
offset_grid you can apply the lat long offset on each of the values and then reshape to get your (x,y) values for each point in the (n,n) expected matrix.
![enter image description here]()
Let's start with a function that offsets lat, long with some x and y meters.
#Offset any lat long by x, y meters
def lat_long_offset(lat, lon, x, y):
    '''
    lat, lon : Provide lat lon coordinates
    x, y : Provide offset of x and y on lat and long respectively
           This needs to be in meters!

    The approximation is taken from an aviation formula from this stack exchange
    https://gis.stackexchange.com/questions/2951/algorithm-for-offsetting-a-latitude-longitude-by-some-amount-of-meters
    '''

    #Earth’s radius, sphere
    R=6378137

    #Coordinate offsets in radians
    dLat = x/R
    dLon = y/(R*np.cos(np.pi*lat/180))

    #OffsetPosition, decimal degrees
    latO = lat + dLat * 180/np.pi
    lonO = lon + dLon * 180/np.pi

    return latO, lonO

#Create a vectorized offset function
lat_long_offset_vec = np.vectorize(lat_long_offset)
Once we have this function ready, we can simply work on the offset grid that we need to apply offsets in all directions to get the relevant point coordinates in lat, long format.
#Create offset_grid and return coordinates
def get_mesh(lat, lon, dist, coors):
    #calculate min and max range for coordinates over an axis
    mini, maxi = -dist*coors, dist*coors

    #calculate number of points over an axis
    n_coord = coors*2+1

    #create an axis from min to max value with required number of coordinates
    axis = np.linspace(mini, maxi, n_coord)

    #create an "offset_grid" for X and Y values for both axis.
    X, Y = np.meshgrid(axis, axis)

    #calcualte offset coordinates for "offset_grid" in meters
    mesh = lat_long_offset_vec(lat, lon, X, Y)

    #Transpose to get the (x,y) values for the offset_grid's shape
    mesh_x_y_format = np.stack(mesh).transpose(1,2,0)
    return mesh_x_y_format

output = get_mesh(50, -10, 100, 2)

print('Shape of output grid:', output.shape)
print('Note: 2 values (x,y) for each point in the expected (5,5) grid')

print('')
print('Output coordinates')
print(output)
Shape of output grid: (5, 5, 2)
Note: 2 values (x,y) for each point in the expected (5,5) grid

Output coordinates
[[[ 49.99820337 -10.00279506]
  [ 49.99910168 -10.00279506]
  [ 50.         -10.00279506]
  [ 50.00089832 -10.00279506]
  [ 50.00179663 -10.00279506]]

 [[ 49.99820337 -10.00139753]
  [ 49.99910168 -10.00139753]
  [ 50.         -10.00139753]
  [ 50.00089832 -10.00139753]
  [ 50.00179663 -10.00139753]]

 [[ 49.99820337 -10.        ]
  [ 49.99910168 -10.        ]
  [ 50.         -10.        ]  #<- Notice the original coordinate at center
  [ 50.00089832 -10.        ]
  [ 50.00179663 -10.        ]]

 [[ 49.99820337  -9.99860247]
  [ 49.99910168  -9.99860247]
  [ 50.          -9.99860247]
  [ 50.00089832  -9.99860247]
  [ 50.00179663  -9.99860247]]

 [[ 49.99820337  -9.99720494]
  [ 49.99910168  -9.99720494]
  [ 50.          -9.99720494]
  [ 50.00089832  -9.99720494]
  [ 50.00179663  -9.99720494]]]


