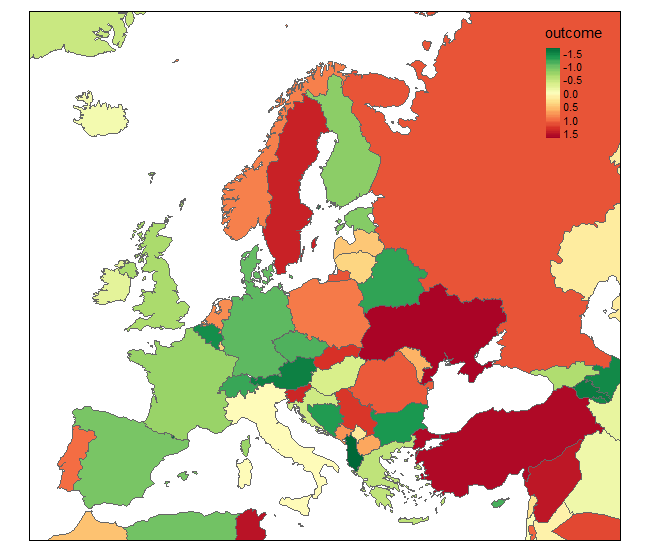
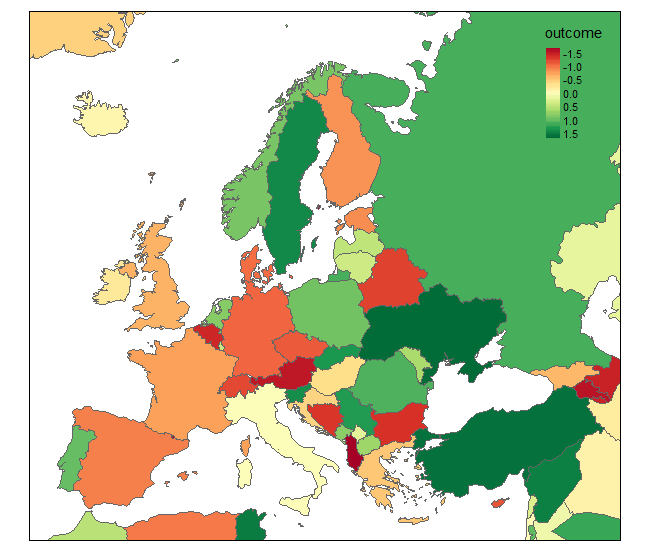
I'm using the R package Tmap to create choropleths of a variable that is sometimes positive and sometimes negative. The default diverging color palette shows positive values in green and negative values in red. I would like to reverse this, to show positive values in red and negative values in green, to conform with my other choropleths that use the sequential palette. I've looked through the manual and tried various things, but I can't seem to get it to work. Here is a reproducible example.
library(tmap)
data(Europe)
Europe$outcome = c(scale(1:nrow(Europe)))
tm_shape(Europe) +
    tm_polygons(col="outcome",
                style="cont")
I've tried "auto.palette.mapping=F", "fill.palette="-div"", "fill.palette="YlGnBu"", etc, but I can't seem to change anything.


palette="-RdYlGn". So the whole thing would betm_polygons(col = "outcome", style ="cont", palette = "-RdYlGn")– Kilauea