JMeter : Generating the default html report not possible with Taurus
Asked Answered
R

2

6

I am currently making a POC with Taurus tool.

In our company we use both JMeter and Gatling for now.

I was able to obtain in my tests the Gatling report without any complex configuration but it was not possible with JMeter to obtain its report.

Could anybody tell me:

  • if it is possible, and if so point me to how to do it ?
  • it it's not, why it's not available while it is for Gatling for example ?

The reason behind this request is that in our company :

  • we limit our test exposure to outside system to public internet sites
  • we want to historize internally the results across time
  • the JMeter HTML report contains very rich information that we need and use to analyze our tests
  • we don't want to be tied accross time to a commercial provider (Blazemeter here), as it appears the only way to get a report would be to use Blazemeter. We might subscribe to it but we don't want to be blocked due to unavailable reports.

I hope it is possible as if not it would be a NO-GO to using Taurus.

Roundfaced answered 21/8, 2018 at 20:8 Comment(1)
I edited my answer and think I have now a viable solution that would work with next 5.0 version.Pathognomy
P
5

It seems that as of now (August 2018 Taurus 1.12.1) , it is not possible in a satisfying and simple way, based on my own tests and answers I got from project here:

Although it is partly possible as per @dmitri-t answer, it is not fully satisfying as there will be some missing information in report and you need to customize per platform which kinds of removes some simplification benefits of Taurus. But hopefully, there are chances it might be introduced in future versions. Maybe you can add a note on google group topic.

Edit on 23/08/2018:

This is the best way I found to have all the graphs generated, still it's not fully satisfying as Taurus overrides for an unknown reason the "Generate Parent Sampler" in Transaction Controller which is a problem for JMeter report:

Due to previous problem, with JMeter 4.0 a lot of graphs are empty, so I used a version that will be upcoming 5.0.

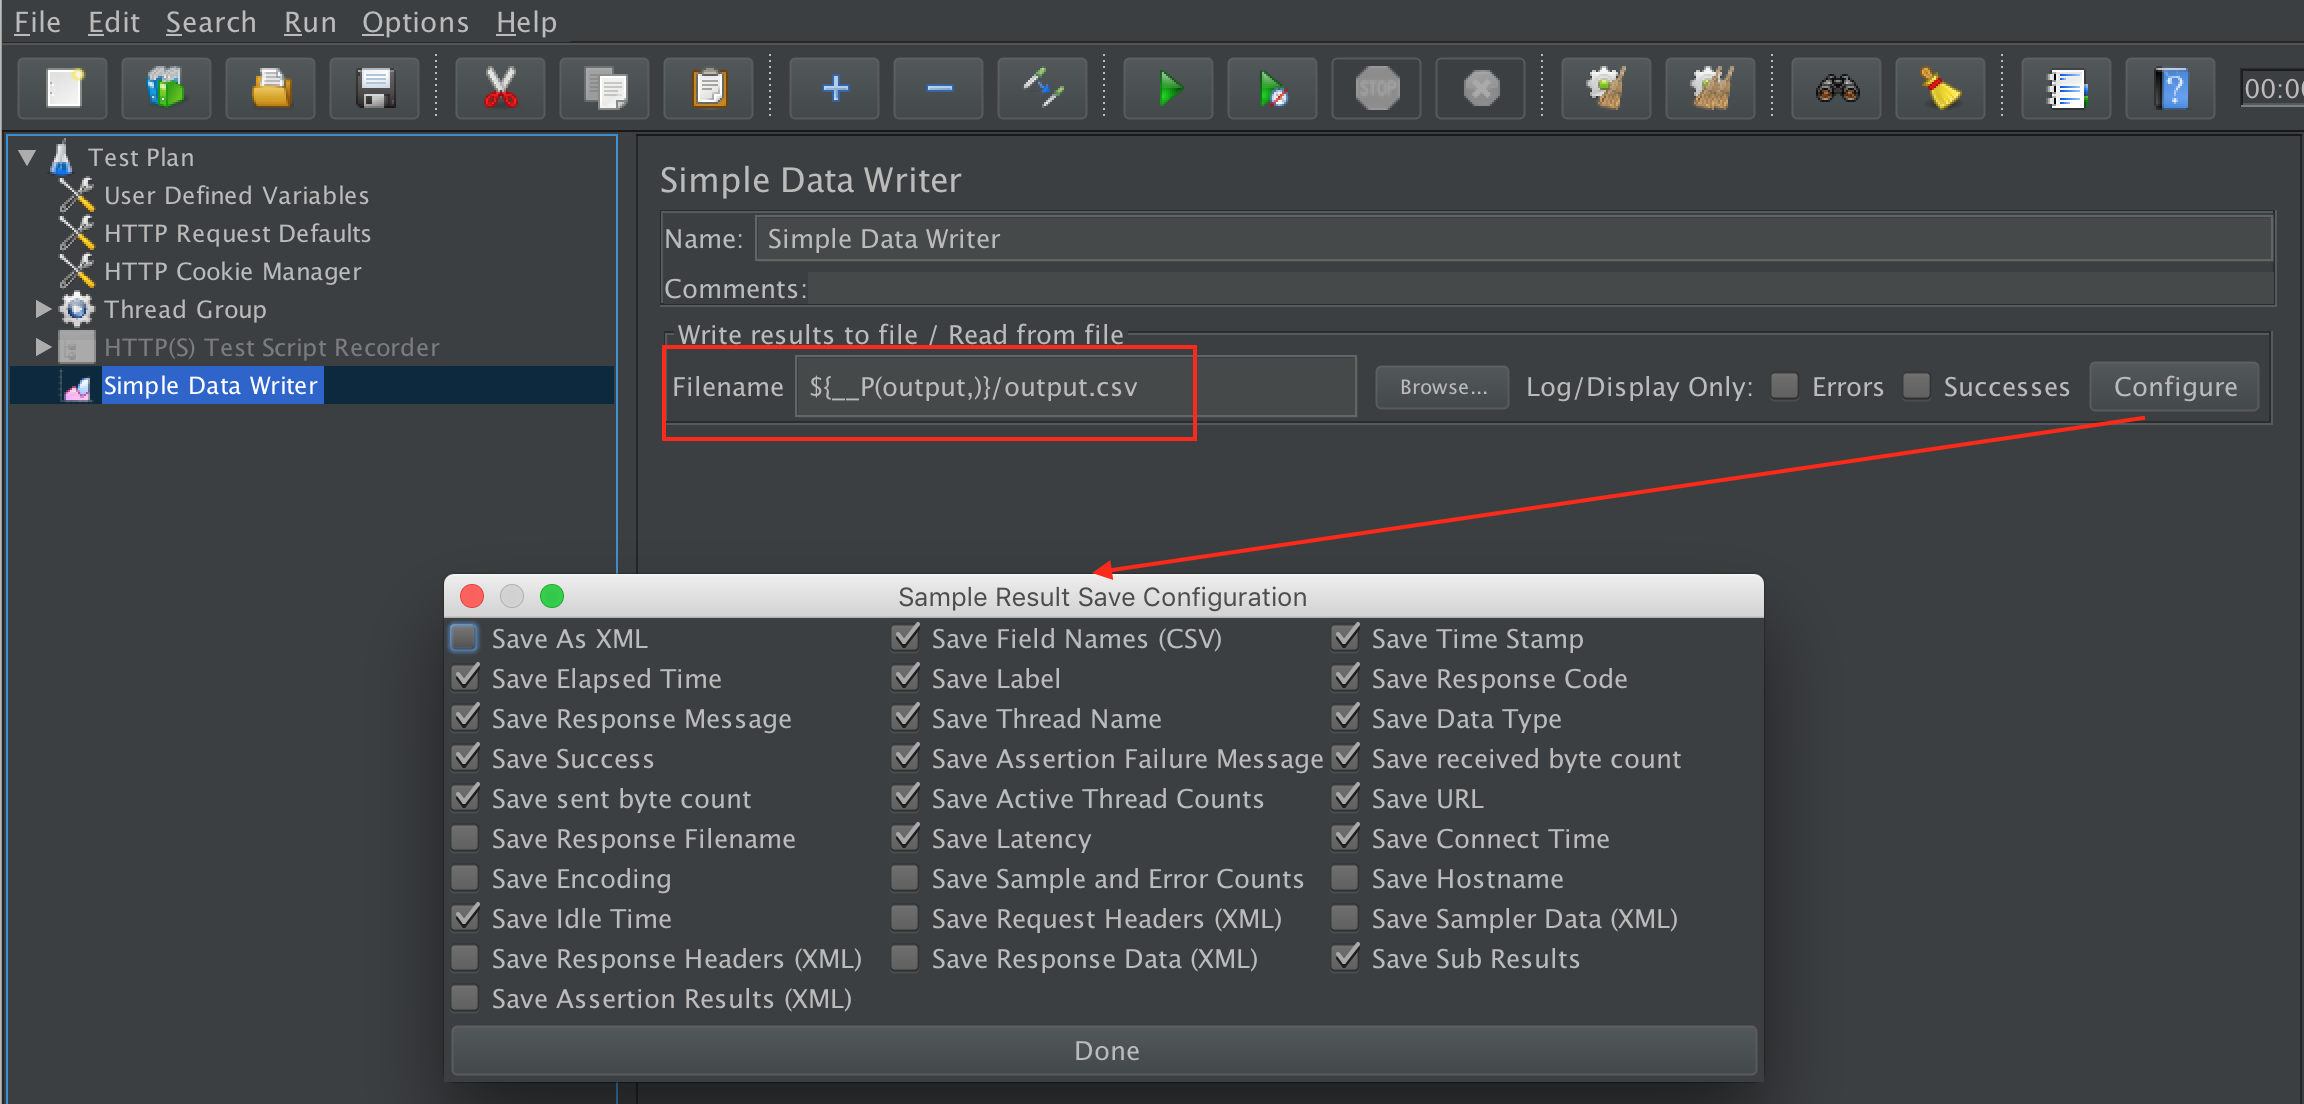
So I added a Simple Data Writer to the test plan.

Notice that I checked in Configure button all CSV fields needed for report:

Simple Data Writer for JMeter Report

Notice also I use a property "output" and __P function:

${__P(output,)}

And finally in the YAML file, I configure:

  • output: ${TAURUS_ARTIFACTS_DIR}/output/
  • Properties used by report:

    • jmeter.reportgenerator.apdex_satisfied_threshold: 1000
    • jmeter.reportgenerator.report_title: JMeter Taurus Demo
    • jmeter.reportgenerator.overall_granularity: 1000
    • jmeter.reportgenerator.exporter.html.series_filter: ^(ClickNext|HP|scenario)(-success|-failure)?$

And my particular property "output":

  • output: ${TAURUS_ARTIFACTS_DIR}/output/

I end up with:

settings:
  env:
     jmeterVersion: r1839007


execution:
- scenario: existing
  concurrency: 5
  hold-for: 10s
  ramp-up: 3s

scenarios:
  existing:
    script: demo.jmx

modules:
  jmeter:
    path: ~/.bzt/jmeter-taurus/${jmeterVersion}/bin/jmeter
    version: ${jmeterVersion}
    download-link: https://ci.apache.org/projects/jmeter/nightlies/${jmeterVersion}/apache-jmeter-${jmeterVersion}.zip
    detect-plugins: false
    properties:
      jmeter.reportgenerator.apdex_satisfied_threshold: 1000
      jmeter.reportgenerator.report_title: JMeter Taurus Demo
      jmeter.reportgenerator.overall_granularity: 1000
      jmeter.reportgenerator.exporter.html.series_filter: ^(ClickNext|HP|scenario)(-success|-failure)?$
      output: ${TAURUS_ARTIFACTS_DIR}/output/

services:
- module: shellexec
  post-process:
  - ~/.bzt/jmeter-taurus/${jmeterVersion}/bin/jmeter -p ~/.bzt/jmeter-taurus/${jmeterVersion}/bin/jmeter.properties -q ${TAURUS_ARTIFACTS_DIR}/jmeter-bzt.properties -g ${TAURUS_ARTIFACTS_DIR}/output/output.csv -o ${TAURUS_ARTIFACTS_DIR}/folder


reporting:
- module: final-stats
- module: console
Pathognomy answered 22/8, 2018 at 9:3 Comment(0)
S
5

As of now Taurus doesn't write failureMessage column into kpi.jtl file which is required for default JMeter Results File Configuration in order to generate the reporting dashboard.

So the options are in:

  1. Create a separate step in order to generate Reporting Dashboard using i.e. Taurus ShellExec service like

    services:
    - module: shellexec
      post-process:
      - ~/.bzt/jmeter-taurus/4.0/bin/./jmeter -Jjmeter.save.saveservice.assertion_results_failure_message=false -g ${TAURUS_ARTIFACTS_DIR}/kpi.jtl -o /path/to/report/folder
    ---
    execution:
      scenario:
        script: test.jmx
    
  2. Configure Taurus to use existing JMeter installation by adding the following lines to .bzt-rc file

    modules:
      jmeter:
        path: /path/to/your/JMeter
    

    Make sure that your existing JMeter installation has jmeter.save.saveservice.assertion_results_failure_message=false line added to user.properties file. Once done you will be able to generate the reporting dashboard out of Taurus kpi.jtl normally

References:

Scabby answered 22/8, 2018 at 4:58 Comment(2)
I tried your answer, but the generated report only reports Transaction Controller and not all HTTP Requests, and following graphs are empty : Response Time Vs Request, Latency Vs Request, Codes Per Second , Hits Per Second, Response Time Overview,Bytes Throughput Over Time. Is there a way to have them ?Roundfaced
I edited my answer and think I have now a viable solution that would work with next 5.0 version.Pathognomy
P
5

It seems that as of now (August 2018 Taurus 1.12.1) , it is not possible in a satisfying and simple way, based on my own tests and answers I got from project here:

Although it is partly possible as per @dmitri-t answer, it is not fully satisfying as there will be some missing information in report and you need to customize per platform which kinds of removes some simplification benefits of Taurus. But hopefully, there are chances it might be introduced in future versions. Maybe you can add a note on google group topic.

Edit on 23/08/2018:

This is the best way I found to have all the graphs generated, still it's not fully satisfying as Taurus overrides for an unknown reason the "Generate Parent Sampler" in Transaction Controller which is a problem for JMeter report:

Due to previous problem, with JMeter 4.0 a lot of graphs are empty, so I used a version that will be upcoming 5.0.

So I added a Simple Data Writer to the test plan.

Notice that I checked in Configure button all CSV fields needed for report:

Simple Data Writer for JMeter Report

Notice also I use a property "output" and __P function:

${__P(output,)}

And finally in the YAML file, I configure:

  • output: ${TAURUS_ARTIFACTS_DIR}/output/
  • Properties used by report:

    • jmeter.reportgenerator.apdex_satisfied_threshold: 1000
    • jmeter.reportgenerator.report_title: JMeter Taurus Demo
    • jmeter.reportgenerator.overall_granularity: 1000
    • jmeter.reportgenerator.exporter.html.series_filter: ^(ClickNext|HP|scenario)(-success|-failure)?$

And my particular property "output":

  • output: ${TAURUS_ARTIFACTS_DIR}/output/

I end up with:

settings:
  env:
     jmeterVersion: r1839007


execution:
- scenario: existing
  concurrency: 5
  hold-for: 10s
  ramp-up: 3s

scenarios:
  existing:
    script: demo.jmx

modules:
  jmeter:
    path: ~/.bzt/jmeter-taurus/${jmeterVersion}/bin/jmeter
    version: ${jmeterVersion}
    download-link: https://ci.apache.org/projects/jmeter/nightlies/${jmeterVersion}/apache-jmeter-${jmeterVersion}.zip
    detect-plugins: false
    properties:
      jmeter.reportgenerator.apdex_satisfied_threshold: 1000
      jmeter.reportgenerator.report_title: JMeter Taurus Demo
      jmeter.reportgenerator.overall_granularity: 1000
      jmeter.reportgenerator.exporter.html.series_filter: ^(ClickNext|HP|scenario)(-success|-failure)?$
      output: ${TAURUS_ARTIFACTS_DIR}/output/

services:
- module: shellexec
  post-process:
  - ~/.bzt/jmeter-taurus/${jmeterVersion}/bin/jmeter -p ~/.bzt/jmeter-taurus/${jmeterVersion}/bin/jmeter.properties -q ${TAURUS_ARTIFACTS_DIR}/jmeter-bzt.properties -g ${TAURUS_ARTIFACTS_DIR}/output/output.csv -o ${TAURUS_ARTIFACTS_DIR}/folder


reporting:
- module: final-stats
- module: console
Pathognomy answered 22/8, 2018 at 9:3 Comment(0)

© 2022 - 2024 — McMap. All rights reserved.