It's not enough to simply install them, you need to integrate prometheus with thanos.
Below I'll describe all steps you need to perform to get the result.
First short theory. The most common approach to integrate them is to use thanos sidecar container for prometheus pod. You can read more here.
How this is done:
(considering that installation is clean, it can be easily deleted and reinstalled from the scratch).
- Get
thanos sidecar added to the prometheus pod.
Pull kube-prometheus-stack chart:
$ helm pull prometheus-community/kube-prometheus-stack --untar
You will have a folder with a chart. You need to modify values.yaml, two parts to be precise:
# Enable thanosService
prometheus:
  thanosService:
    enabled: true # by default it's set to false

# Add spec for thanos sidecar
prometheus:
  prometheusSpec:
    thanos:
      image: "quay.io/thanos/thanos:v0.24.0"
      version: "v0.24.0"
Keep in mind, this feature is still experimental:
## This section is experimental, it may change significantly without deprecation notice in any release.
## This is experimental and may change significantly without backward compatibility in any release.
## ref: https://github.com/prometheus-operator/prometheus-operator/blob/main/Documentation/api.md#thanosspec
Once it's done, install the prometheus chart with edited values.yaml:
$ helm install prometheus . -n prometheus --create-namespace # installed in prometheus namespace
And check that sidecar is deployed as well:
$ kubectl get pods -n prometheus | grep prometheus-0
prometheus-prometheus-kube-prometheus-prometheus-0       3/3     Running   0          67s
It should be 3 containers running (by default it's 2). You can inspect it in more details with kubectl describe command.
- Setup
thanos chart and deploy it.
Pull the thanos chart:
$ helm pull bitnami/thanos --untar
Edit values.yaml:
query:
  dnsDiscovery:
    enabled: true
    sidecarsService: "prometheus-kube-prometheus-thanos-discovery" # service which was created before
    sidecarsNamespace: "prometheus" # namespace where prometheus is deployed
Save and install this chart with edited values.yaml:
$ helm install thanos . -n thanos --create-namespace
Check that it works:
$ kubectl logs thanos-query-xxxxxxxxx-yyyyy -n thanos
We are interested in this line:
level=info ts=2022-02-24T15:32:41.418475238Z caller=endpointset.go:349 component=endpointset msg="adding new sidecar with [storeAPI rulesAPI exemplarsAPI targetsAPI MetricMetadataAPI]" address=10.44.1.213:10901 extLset="{prometheus=\"prometheus/prometheus-kube-prometheus-prometheus\", prometheus_replica=\"prometheus-prometheus-kube-prometheus-prometheus-0\"}"
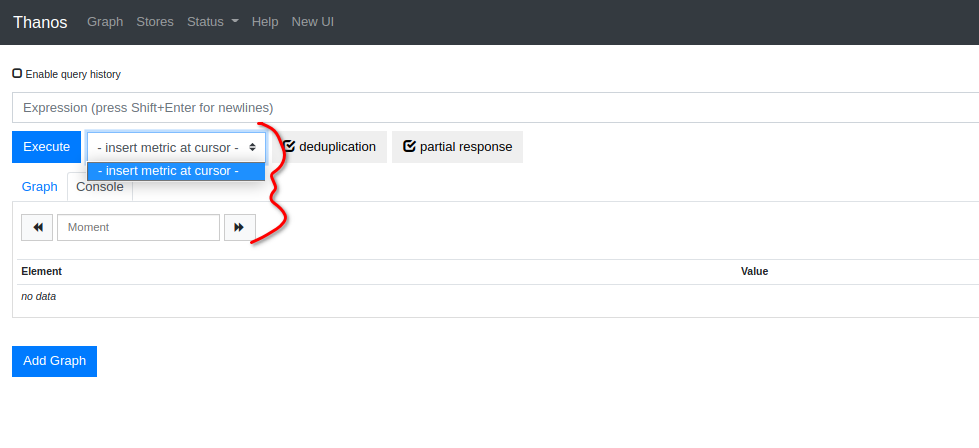
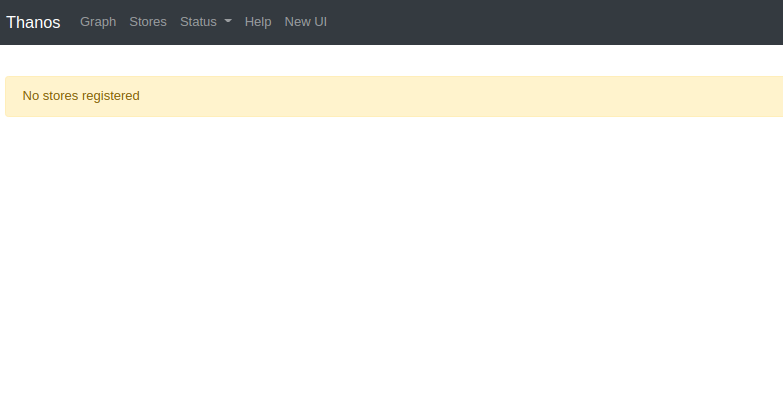
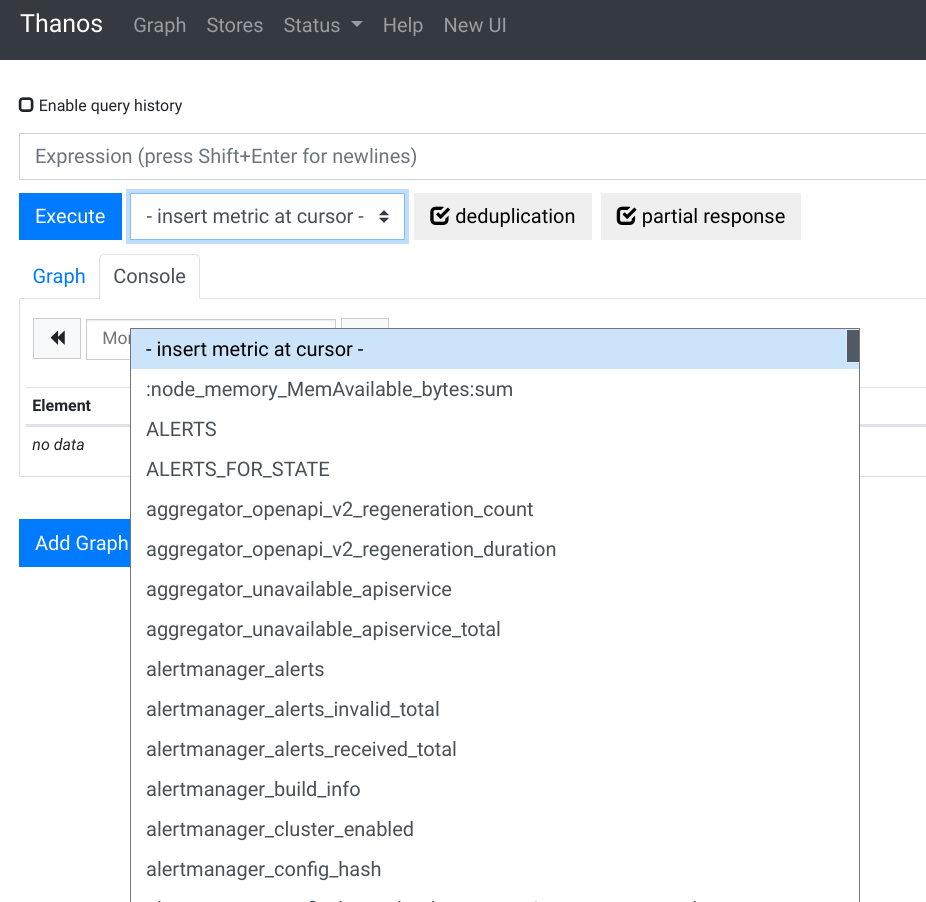
- Now go to the UI and see that metrics are available:
![enter image description here]()
Good article to read:


