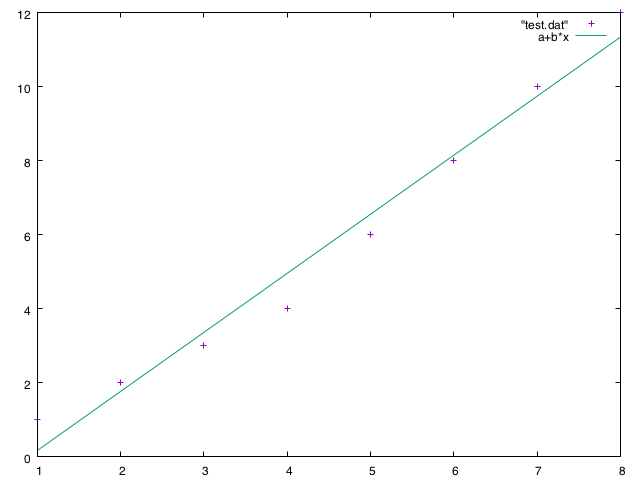
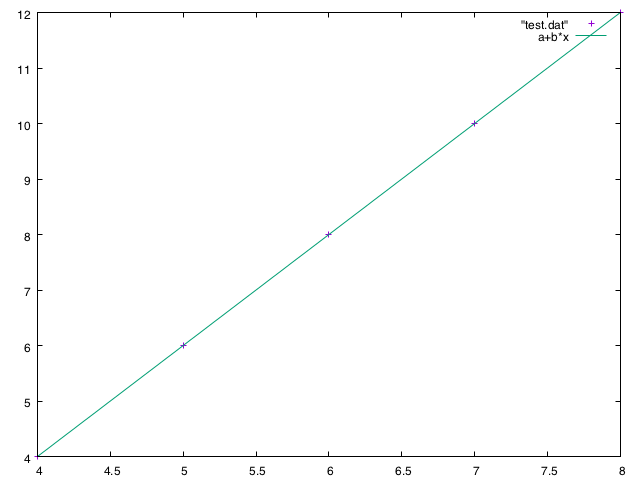
Simple question - the range drawn on a plot can be changed with the set xrange [x_min:x_max] command.
Does this command also limit the range used when fitting a function using the data fitting tools in gnuplot? Is there a way to manually specify the ranged used for function fits? (One guess might be the command every? Do I need to over-ride xrange using every?)
The reason I ask is that I am using xrange to plot outputs zoomed in on the low value x region to view transient behaviour more clearly, but I think this may be "slicing off" values from the function fitting at larger x values outside the xrange region selected?


