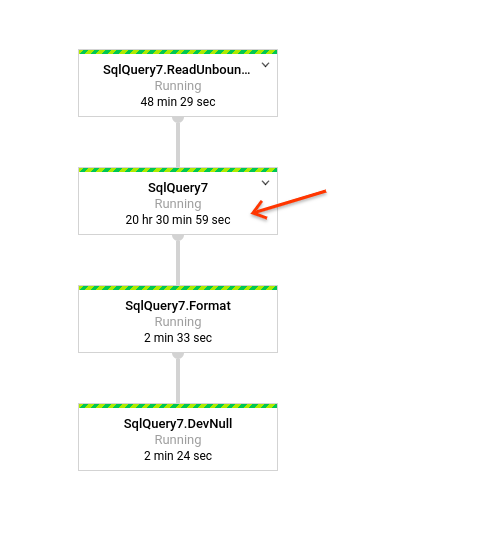
I have a Dataflow job that is not making progress - or it is making very slow progress, and I do not know why. How can I start looking into why the job is slow / stuck?
The first resource that you should check is Dataflow documentation. It should be useful to check these:
If these resources don't help, I'll try to summarize some reasons why your job may be stuck, and how you can debug it. I'll separate these issues depending on which part of the system is causing the trouble. Your job may be:
Job stuck at startup
A job can get stuck being received by the Dataflow service, or starting up new Dataflow workers. Some risk factors for this are:
- Did you add a custom
setup.pyfile? - Do you have any dependencies that require a special setup on worker startup?
- Are you manipulating the worker container?
To debug this sort of issue I usually open StackDriver logging, and look for worker-startup logs (see next figure). These logs are written by the worker as it starts up a docker container with your code, and your dependencies. If you see any problem here, it would indicate an issue with your setup.py, your job submission, staged artifacts, etc.
Another thing you can do is to keep the same setup, and run a very small pipeline that stages everything:
with beam.Pipeline(...) as p:
  (p
   | beam.Create(['test element'])
   | beam.Map(lambda x: logging.info(x)))
If you don't see your logs in StackDriver, then you can continue to debug your setup. If you do see the log in StackDriver, then your job may be stuck somewhere else.
Job seems stuck in user code
Something else that could happen is that your job is performing some operation in user code that is stuck or slow. Some risk factors for this are:
- Is your job performing operations that require you to wait for them? (e.g. loading data to an external service, waiting for promises/futures)
- Note that some of the builtin transforms of Beam do exactly this (e.g. the Beam IOs like BigQueryIO, FileIO, etc).
- Is your job loading very large side inputs into memory? This may happen if you are using
View.AsListfor a side input. - Is your job loading very large iterables after
GroupByKeyoperations?
A symptom of this kind of issue can be that the pipeline's throughput is lower than you would expect. Another symptom is seeing the following line in the logs:
Processing stuck in step <STEP_NAME>/<...>/<...> for at least <TIME> without outputting or completing in state <STATE>
    .... <a stacktrace> ....
In cases like these it makes sense to look at which step is consuming the most time in your pipeline, and inspect the code for that step, to see what may be the problem.
Some tips:
Very large side inputs can be troublesome, so if your pipeline relies on accessing a very large side input, you may need to redesign it to avoid that bottleneck.
It is possible to have asynchronous requests to external services, but I recommend that you commit / finalize work on
startBundleandfinishBundlecalls.If your pipeline's throughput is not what you would normally expect, it may be because you don't have enough parallelism. This can be fixed by a
Reshuffle, or by sharding your existing keys into subkeys (Beam often does processing per-key, and so if you have too few keys, your parallelism will be low) - or using aCombinerinstead ofGroupByKey+ParDo.Another reason that your throughput is low may be that your job is waiting too long on external calls. You can try addressing this by trying out batching strategies, or async IO.
In general, there's no silver bullet to improve your pipeline's throughput,and you'll need to have experimentation.
The data freshness or system lag are increasing
First of all, I'd recommend you check out this presentation on watermarks.
For streaming, the advance of the watermarks is what drives the pipeline to make progress, thus, it is important to be watchful of things that could cause the watermark to be held back, and stall your pipeline downstream. Some reasons why the watermark may become stuck:
- One possibility is that your pipeline is hitting an unresolvable error condition. When a bundle fails processing, your pipeline will continue to attempt to execute that bundle indefinitely, and this will hold the watermark back.
- When this happens, you will see errors in your Dataflow console, and the count will keep climbing as the bundle is retried. See:
- You may have a bug when associating the timestamps to your data. Make sure that the resolution of your timestamp data is the correct one!
- Although unlikely, it is possible that you've hit a bug in Dataflow. If neither of the other tips helps, please open a support ticket.
© 2022 - 2024 — McMap. All rights reserved.


