Why is increase() showing only zero values when I can see the metric value increasing?
Asked Answered
B

2

6

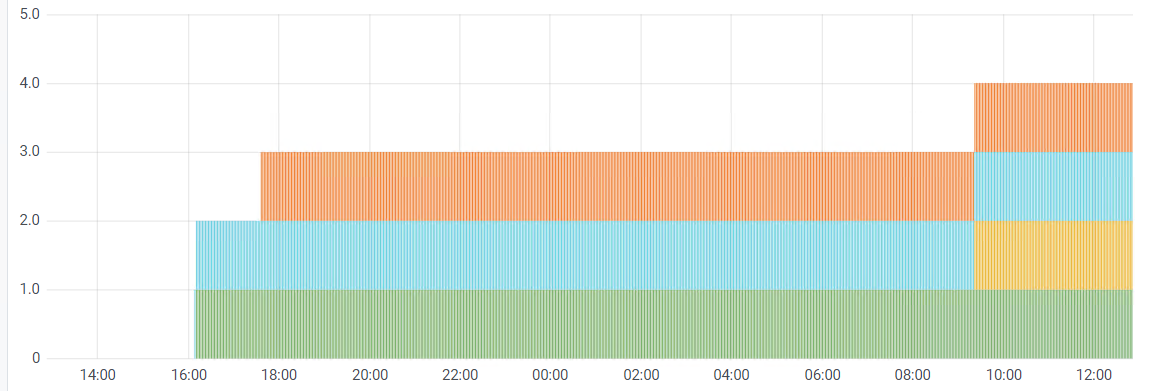
I am using Grafana to visualise a Prometheus time-series. When I simply set my stacked graph to visualise my_metric I get this: enter image description here

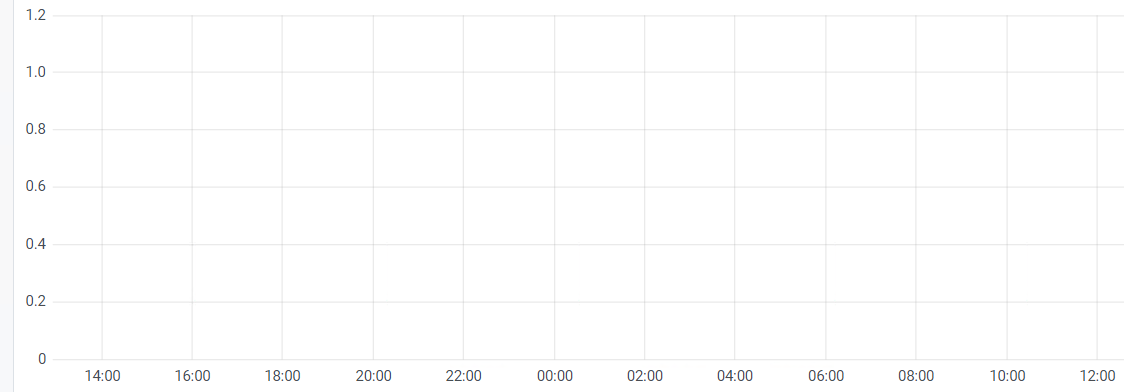
If I change to increase(my_metric[1h]) I get all zeroes:

enter image description here

Everything else is basically the defaults so I don't understand. I can see the values change so am I misunderstanding something how increase() works?

Besetting answered 15/6, 2021 at 12:0 Comment(3)
Can you share the two queries you're doing ?Keaton
@MarcABOUCHACRA no it's confidential, which is tricky!Besetting
I understand ! However the question was more "are you using some kind of function or aggregation in your query". But i guess no, and the query is just the one you posted (except for the name of course). Anyway, Brian answer is the right one. I missed the fact that the values start at one in your screenshotKeaton
P
10

There's no increases there, the time series appear with the value 1. If they had increased from 0 to 1 rather than nothing to 1 then increase would show a non-zero value. I'd recommend initialising your metrics with the label values you know about.

Putscher answered 16/6, 2021 at 9:23 Comment(1)
Oh that's a great call. I shall have to double check but it would certainly explain. Is there a way to get increase() to work as I wish here, if I cannot get the metric initialised?Besetting
P
1

I had the same problem, you need to get the occurrences in the range of 30 days or more, but when doing this it always returns 0, even if when doing sum(http_requests_received_total{job="TodoApi"}) it returned values.

The solution is the following, as each sample of the requests occurred in the prometheus Scrap Interval, you should then use the same interval to fetch that sample. But keeping this value in your hand, for example mine has 15s would not be feasible, since when increasing the range to 1d or more days the interval increases proportionally, this logic of the proportion I still don't understand, but there is a solution to get this value automatically using $__interval it takes the exact value, in this way the increase that previously brought a non-integer value now returns. Mine worked as follows:

increase( sum(http_requests_received_total{job="TodoApi"}) [$__interval:] )

Besides using $__interval also use : it will tell prometheus to look within the time interval obtained in $__interval:

enter image description here
Piscatorial answered 27/7, 2023 at 23:6 Comment(0)

© 2022 - 2024 — McMap. All rights reserved.