I'm working on a Python function, where I want to model a Gaussian distribution, I'm stuck though.
import numpy.random as rnd
import numpy as np

def genData(co1, co2, M):
  X = rnd.randn(2, 2M + 1)
  t = rnd.randn(1, 2M + 1)
  numpy.concatenate(X, co1)
  numpy.concatenate(X, co2)
  return(X, t)
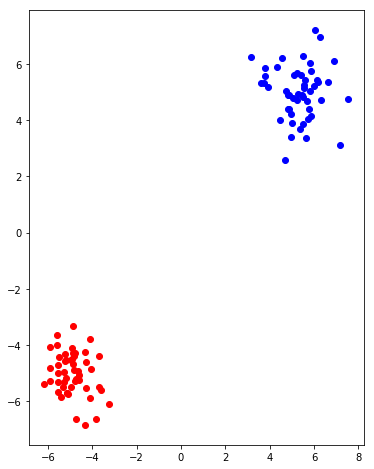
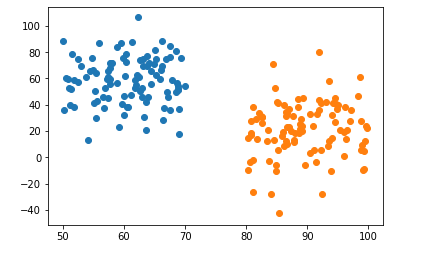
I'm trying for two clusters of size M, cluster 1 is centered at co1, cluster 2 is centered at co2. X would return the data points I'm going to graph, and t are the target values (1 if cluster 1, 2 if cluster 2) so I can color it by cluster.
In that case, t is size 2M of 1s/2s and X is size 2M * 1, wherein t[i] is 1 if X[i] is in cluster 1 and the same for cluster 2.
I figured the best way to start doing this is generating the array array using numpys random. What I'm confused about is how to get it centered according to the cluster?
Would the best way be to generate a cluster sized M, then add co1 to each of the points? How would I make it random though, and make sure t[i] is colored in properly?
I'm using this function to graph the data:
def graphData():
    co1 = (0.5, -0.5)
    co2 = (-0.5, 0.5)
    M = 1000
    X, t = genData(co1, co2, M)
    colors = np.array(['r', 'b'])
    plt.figure()
    plt.scatter(X[:, 0], X[:, 1], color = colors[t], s = 10)


meanargument as a vector of length 2; that will be the location of the cluster. – Hargett