Plot circular gradients using numpy
Asked Answered
A

2

6

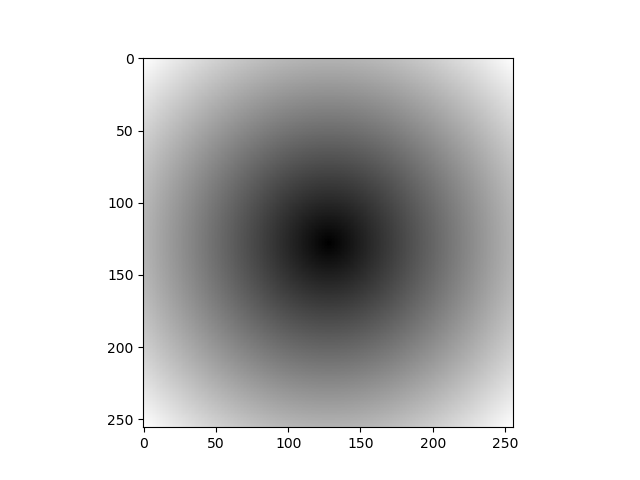
I have a code for plotting radial gradients with numpy. So far it looks like this:

import numpy as np
import matplotlib.pyplot as plt

arr = np.zeros((256,256,3), dtype=np.uint8)
imgsize = arr.shape[:2]
innerColor = (0, 0, 0)
outerColor = (255, 255, 255)
for y in range(imgsize[1]):
    for x in range(imgsize[0]):
        #Find the distance to the center
        distanceToCenter = np.sqrt((x - imgsize[0]//2) ** 2 + (y - imgsize[1]//2) ** 2)

        #Make it on a scale from 0 to 1innerColor
        distanceToCenter = distanceToCenter / (np.sqrt(2) * imgsize[0]/2)

        #Calculate r, g, and b values
        r = outerColor[0] * distanceToCenter + innerColor[0] * (1 - distanceToCenter)
        g = outerColor[1] * distanceToCenter + innerColor[1] * (1 - distanceToCenter)
        b = outerColor[2] * distanceToCenter + innerColor[2] * (1 - distanceToCenter)
        # print r, g, b
        arr[y, x] = (int(r), int(g), int(b))

plt.imshow(arr, cmap='gray')
plt.show()

Is there any way to optimize this code with numpy functions and improve speed? It should look like this afterwards: Circular gradient
Assignable answered 14/3, 2019 at 9:29 Comment(2)
If talking in a simplistic sense, you want a 250x250 numpy array, at index 124,124 you want the value to be zero, and want the value to increase based on that points Euclidean distance from the centre?Nomenclature
Exactly, but for a 256x256 numpy arrayAssignable
T
10

You can use vectorization to very efficiently calculate the distance without the need for a for-loop:

x_axis = np.linspace(-1, 1, 256)[:, None]
y_axis = np.linspace(-1, 1, 256)[None, :]

arr = np.sqrt(x_axis ** 2 + y_axis ** 2)

or you can use a meshgrid:

x_axis = np.linspace(-1, 1, 256)
y_axis = np.linspace(-1, 1, 256)

xx, yy = np.meshgrid(x_axis, y_axis)
arr = np.sqrt(xx ** 2 + yy ** 2)

and interpolate between inner and outer colors using broadcasting again

inner = np.array([0, 0, 0])[None, None, :]
outer = np.array([1, 1, 1])[None, None, :]

arr /= arr.max()
arr = arr[:, :, None]
arr = arr * outer + (1 - arr) * inner
Tapping answered 14/3, 2019 at 10:30 Comment(0)
L
2

Because of symmetry, actually just need to calculate one-fourth of image 256*256 which is 64*64, then rotate it with 90 degrees piece by piece and combine them. In this way, the total time is 1/4 times than calculating 256*256 pixel.

the following is example.

import numpy as np
import matplotlib.pyplot as plt

##Just calculate 64*64
arr = np.zeros((64,64,3), dtype=np.uint8)
imgsize = arr.shape[:2]
innerColor = (0, 0, 0)
outerColor = (255, 255, 255)
for y in range(imgsize[1]):
    for x in range(imgsize[0]):
        #Find the distance to the corner
        distanceToCenter = np.sqrt((x) ** 2 + (y - imgsize[1]) ** 2)

        #Make it on a scale from 0 to 1innerColor
        distanceToCenter = distanceToCenter / (np.sqrt(2) * imgsize[0])

        #Calculate r, g, and b values
        r = outerColor[0] * distanceToCenter + innerColor[0] * (1 - distanceToCenter)
        g = outerColor[1] * distanceToCenter + innerColor[1] * (1 - distanceToCenter)
        b = outerColor[2] * distanceToCenter + innerColor[2] * (1 - distanceToCenter)
        # print r, g, b
        arr[y, x] = (int(r), int(g), int(b))
#rotate and combine
arr1=arr
arr2=arr[::-1,:,:]
arr3=arr[::-1,::-1,:]
arr4=arr[::,::-1,:]
arr5=np.vstack([arr1,arr2])
arr6=np.vstack([arr4,arr3])
arr7=np.hstack([arr6,arr5])
plt.imshow(arr7, cmap='gray')
plt.show()
Lougheed answered 14/3, 2019 at 10:15 Comment(0)

© 2022 - 2024 — McMap. All rights reserved.