How can I debug an Angular multi-project workspace in VSCode using the VS Code - Debugger for Chrome? After the migration to an Angular multi-project workspace, the debugging does not work anymore. I get the following message if I set a breakpoint.
Breakpoint set but not yet bound
I found a blog post about this topic: "Visual Studio Code Breakpoints for Angular Multi-Project Workspace". I added the following to my launch.json, I replaced "webRoot": "${workspaceRoot}"" with "webRoot": "${workspaceFolder}":
{
    "name": "Launch new-app in Chrome against localhost (with sourcemaps)",
    "type": "chrome",
    "request": "launch",
    "runtimeExecutable": "/usr/bin/chromium-browser",
    "runtimeArgs": [
        "--disable-extensions"
    ],
    "url": "http://localhost:4200",
    "webRoot": "${workspaceFolder}",
    "sourceMaps": true,
    "sourceMapPathOverrides": {
        "/./*": "${webRoot}/projects/new-app/*",
        "/src/*": "${webRoot}/projects/new-app/src/*",
        "/*": "*",
        "/./~/*": "${webRoot}/node_modules/*",
    },
}
I also replaced new-app with the correct app name, but it does still not work.
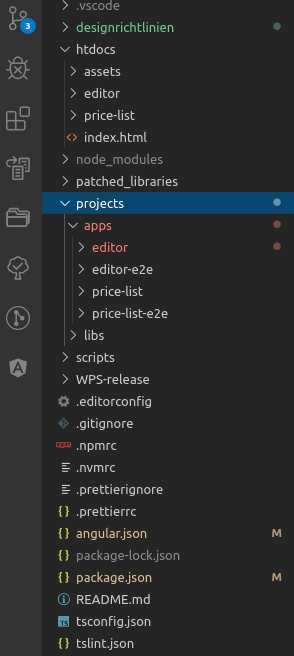
The folder structure:
Can anyone help me to get this working?


new-app(one application at a time), but there are also other apps. – Kubiakng serveruns a server at localhost:4200 by default. If you try to serve up multiple apps, that won't work. So, serve your app, and configure your chrome debugger plugin to connect to localhost:4200. Then it doesn't matter which one you have loaded, the sources will be pulled in automatically. – Expugnable