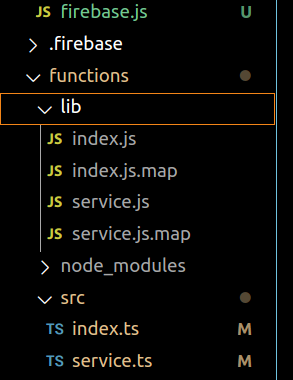
I have a set of Cloud Functions that perform CRUD-like functions to get an individual resource, list resources and so forth, getWidgetByURL, listWidgets, deleteWidget.
For a broader context, these are written in a single src/service.ts file and the src/index.ts exposes a set of callables:
import * as functions from 'firebase-functions'
import * as service from './service'

const region = 'europe-west1'

exports.addJob = functions.region(region).https.onCall(async (data, context) => {
  try {
    functions.logger.debug('addJob called with data', data)
    const job = await service.addJob(data.title, data.company,
      data.location, data.applyUrl, data.salary, data.tags)
    return job
  } catch (err) {
    functions.logger.error(err)
    throw new functions.https.HttpsError('internal', 'internal server error', err)
  }
})
During the development cycle I run npm run build locally to compile to JavaScript into the target lib directory. Note the *.map files are produced.
In production, if a runtime error occurs, the stacktrace shown within Firebase console logs shows only the .js files callstack.
The debug process involves having to locate the runtime error in my local lib/service.js file and then by manually find the corresponding line in the corresponding source code lib/service.ts file. Tedious.
Is it possible for stacktraces to automatically make use of the .map files to produce something more useable? If not, what is the best practice/workflow?


