Why does VisualVm does not show all threads in a running tomcat?
Asked Answered
I

4

6

My tomcat (version: 5.5.25) runs an application which I try to profile with VisualVM (ver: 1.3.2). Everything looks nice but not all classes and methods are shown in visualVM. They ones that are missing run in thread [main]. I know this because this is the thread's name I receive if I a breakpoint has been hit. Classes which run outside main e.g. [worker1] , [worker2], ... are shown correctly.

Any idea what the reasons might be? Or what I could try?

Since the application I run (it is called Assentis Docbase) is closed-source they might have customized the default tomcat configuration. But they allowed me to extend the framework with my own classes and that are the ones I want to profile.

VisualVM I run with the default configuration as downloaded.

Imidazole answered 25/7, 2011 at 8:49 Comment(2)
Are you certain they haven't renamed the main thread?Founder
I am a little bit new to profiling tomcat. How to I check it?Kessia
I
8

You probably need to customize profiling root methods. See Profiling With VisualVM, Part 1 and Profiling With VisualVM, Part 2. You can also use 'Sampler' tab to get high-level picture of what is your Tomcat doing.

Inestimable answered 25/7, 2011 at 18:56 Comment(1)
Thats it! if you set root method on a high level you need to add two * (stars) after the dot. e.g. "mypackage.**"Kessia
C
2

Here are a couple of reasons why you may not be able to see the "main" thread:

  • The thread could have exited.

  • The thread could have changed its name by calling Thread.setName().

If you want to figure out the real reason, you will probably need to look at the Tomcat source code.


This page tells you where the settings are. Google is your friend.

Cecilacecile answered 25/7, 2011 at 9:50 Comment(3)
But if I start profiling before I call the method and stop after method has been called, than the main thread should have been called and must result in an entry in profiler? Doesn't it?Kessia
It seems that there is a setting called "Limit number of profiled threads". So my main thread is not profiled because it is e.g. thread number 33. But I do know how/where to set it. Any ideas?Kessia
@Stephen I alreday found the same link, but it only describe how you can use the settings if you use the eclipse-plugin of visualVM.Kessia
I
2

The reason why VisualVM did not show my method calls in thread [main] is that VisualVM allows only to profile up to 32 threads simoultanously. It is NOT possible to allow more threads to be watched. This has been documented in Profiling With VisualVM, Part 2, section "Comparison With The NetBeans Profiler" they say:

"Profiled threads limit is always 32."

:-(

Imidazole answered 26/7, 2011 at 11:45 Comment(4)
I don't think that this is valid in your case. Did you set the root methods?Inestimable
I added to "Start profiling from classes" with the top-level package name where my method lives in. But it is not called. I think that the thread limit really is the reason because Aseentis Docbase creates a lot of new threads. They are needed because it is used for batch processing large files for outputmanagement.Kessia
Now I got it with the root methods. It is "mypackage.**" I forget one . So "mypackage." is not working. I am happy now!Kessia
Ok, I am glad it works for you. Yes, "mypackage." does not work. There is a tooltip in the "Start profiling from classes" text area, which tells you correct syntax. Also the blogs.oracle.com/nbprofiler/entry/… post mentions the correct syntax.Inestimable
O
1

You've probably badly configured "Start profiling from classes" in the plugin config.

Say you've configured org.acme.competition.* (A) for profiling:

VisualVM Startup config dialog

but you've accidentally profiled the class org.acme.reference.ReferenceImpl (B) using a command lie this:

$ cat source.txt | java -Xverify:none \
    -agentpath:/usr/share/visualvm/profiler/lib/deployed/jdk16/linux-amd64/libprofilerinterface.so=/usr/share/visualvm/profiler/lib,5140 \
    -cp bin/ org.acme.reference.ReferenceImpl

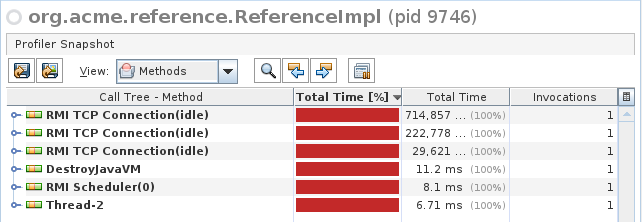
then this would be the wrong result:

Wrong result

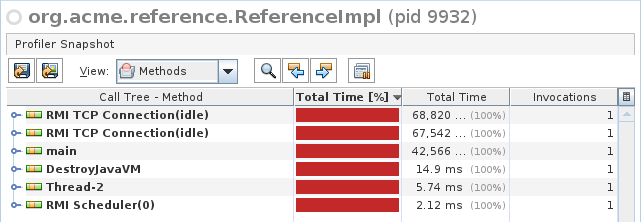
When configuring VisualVM's Startup plugin config "Start profiling from classes" with org.acme.reference.* instead, the result is correct:

Correct result

See the Startup profiler guide too.

Oliviaolivie answered 25/8, 2017 at 20:19 Comment(0)

© 2022 - 2024 — McMap. All rights reserved.