Data
I have the following (simplified) dataset, we call df from now on:
                     species    rank                   value
1           Pseudomonas putida  family        Pseudomonadaceae
2       Pseudomonas aeruginosa  family        Pseudomonadaceae
3  Enterobacter xiangfangensis  family      Enterobacteriaceae
4          Salmonella enterica  family      Enterobacteriaceae
5        Klebsiella pneumoniae  family      Enterobacteriaceae
6           Pseudomonas putida   genus             Pseudomonas
7       Pseudomonas aeruginosa   genus             Pseudomonas
8  Enterobacter xiangfangensis   genus            Enterobacter
9          Salmonella enterica   genus              Salmonella
10       Klebsiella pneumoniae   genus              Klebsiella
11          Pseudomonas putida species      Pseudomonas putida
12      Pseudomonas aeruginosa species  Pseudomonas aeruginosa
13 Enterobacter xiangfangensis species Enterobacter hormaechei
14         Salmonella enterica species     Salmonella enterica
15       Klebsiella pneumoniae species   Klebsiella pneumoniae
What I want to achieve
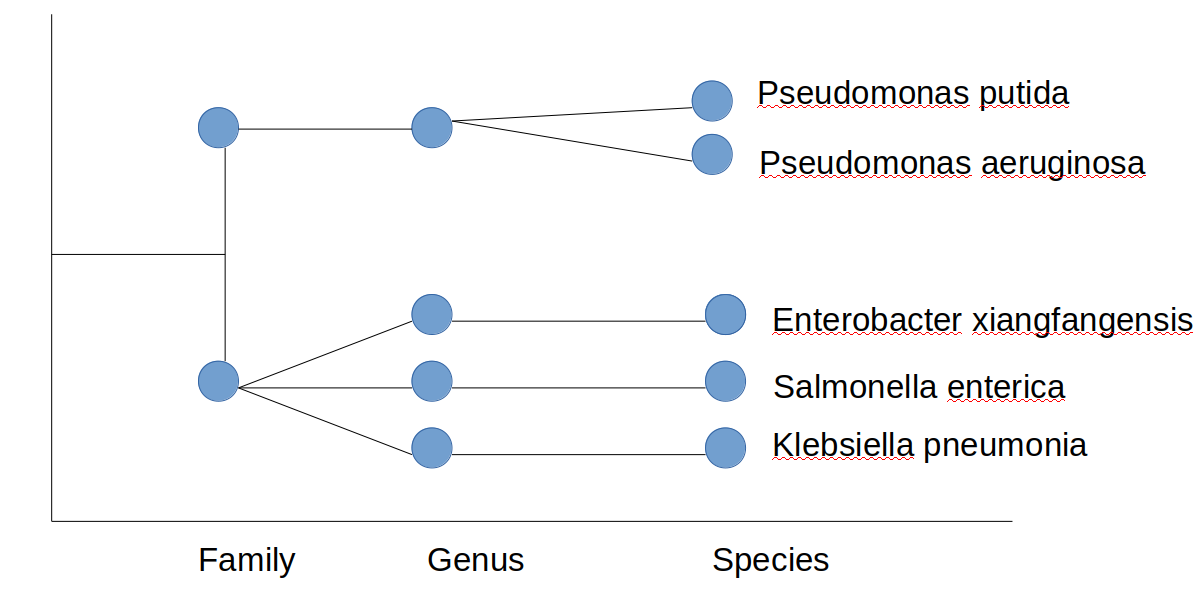
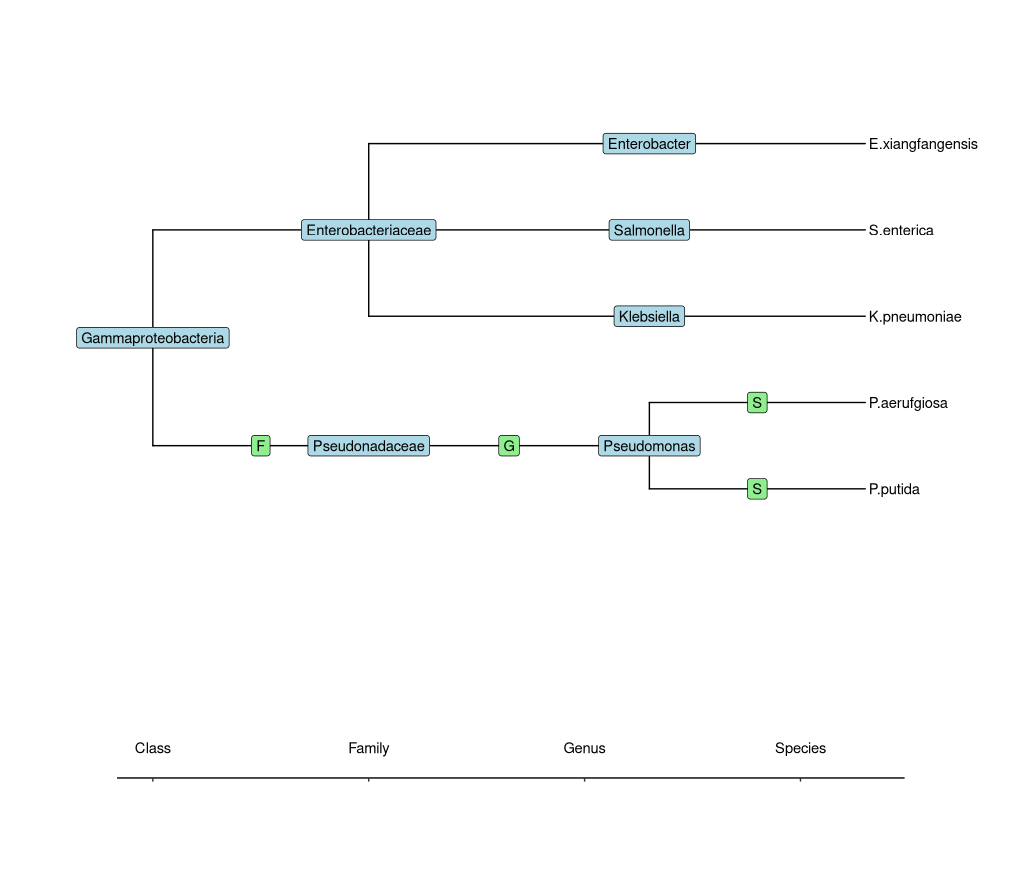
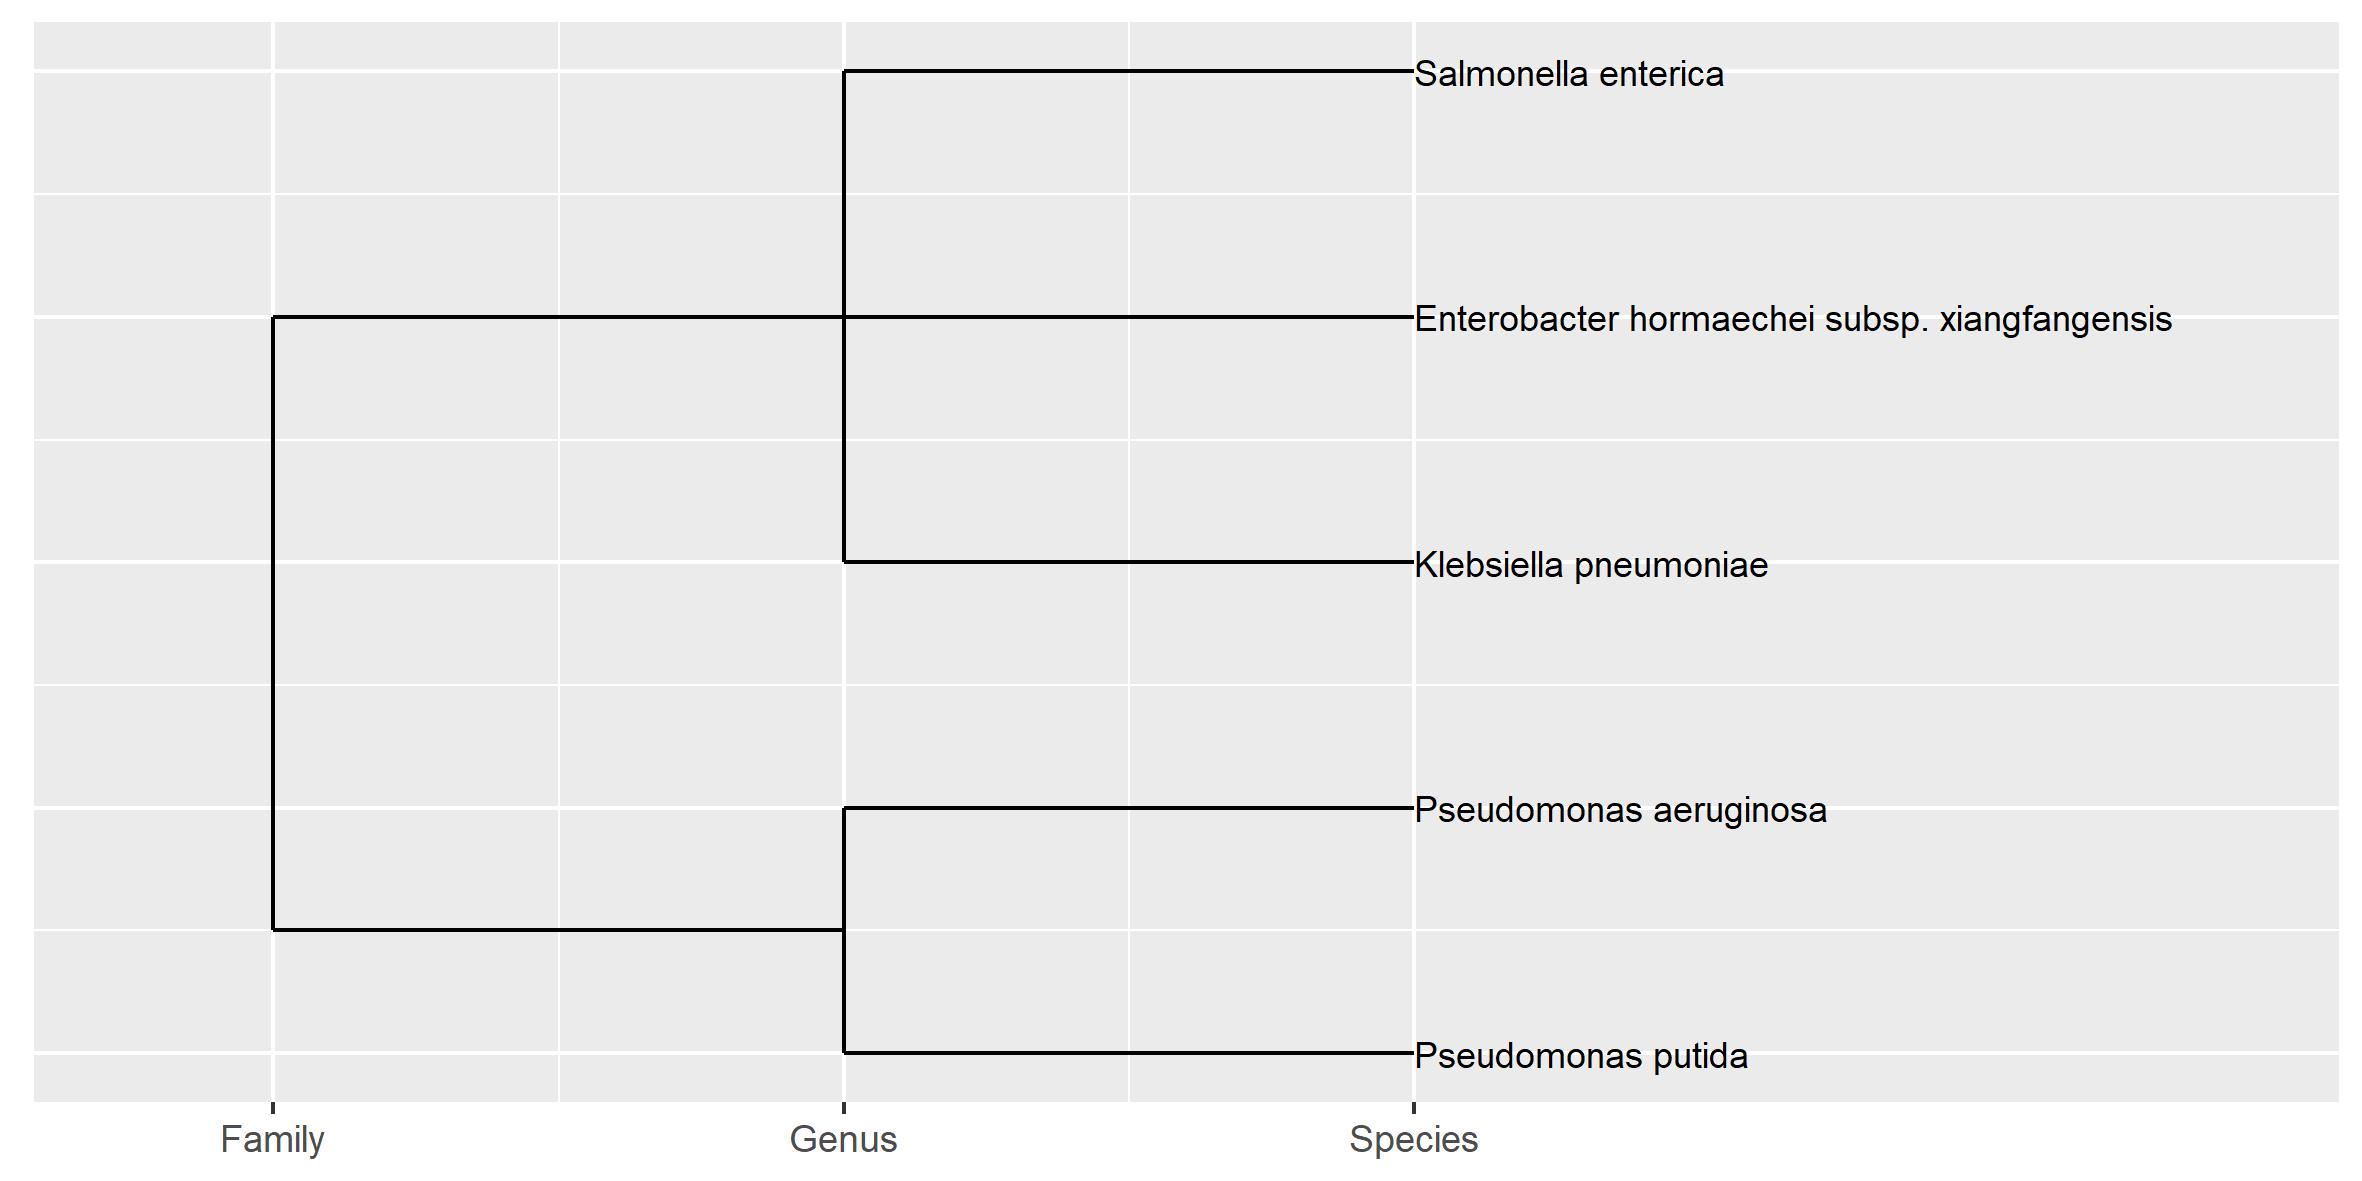
This data is taxonomy data that shows the species classification, where the rank is in order of family > genus > species. Due to the hierarchical nature I want to show this as a tree, preferentially in ggplot2 like so:
What I tried
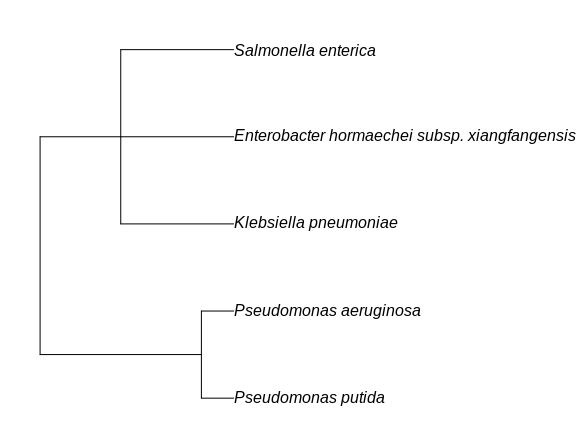
While I found a package, taxize written to convert this (actually the full classification - only partially shown here) to a tree, using class2tree:
class.dat <- classification(c("Pseudomonas putida", "Pseudomonas aeruginosa","Enterobacter xiangfangensis","Salmonella enterica","Klebsiella pneumoniae"), db = 'ncbi')
taxize::class2tree(class.dat)
This does not show the ranks like in my hand made graph, that I need in my visualization:
EDIT: dput of data
structure(list(species = c("Pseudomonas putida", "Pseudomonas putida",
"Pseudomonas putida", "Pseudomonas aeruginosa", "Pseudomonas aeruginosa",
"Pseudomonas aeruginosa", "Enterobacter xiangfangensis", "Enterobacter xiangfangensis",
"Enterobacter xiangfangensis", "Salmonella enterica", "Salmonella enterica",
"Salmonella enterica", "Klebsiella pneumoniae", "Klebsiella pneumoniae",
"Klebsiella pneumoniae"), rank = c("family", "genus", "species",
"family", "genus", "species", "family", "genus", "species", "family",
"genus", "species", "family", "genus", "species"), value = c("Pseudomonadaceae",
"Pseudomonas", "Pseudomonas putida", "Pseudomonadaceae", "Pseudomonas",
"Pseudomonas aeruginosa", "Enterobacteriaceae", "Enterobacter",
"Enterobacter hormaechei", "Enterobacteriaceae", "Salmonella",
"Salmonella enterica", "Enterobacteriaceae", "Klebsiella", "Klebsiella pneumoniae"
)), row.names = c(NA, -15L), class = "data.frame", .Names = c("species",
"rank", "value"))
EDIT: Response to @StupidWolf
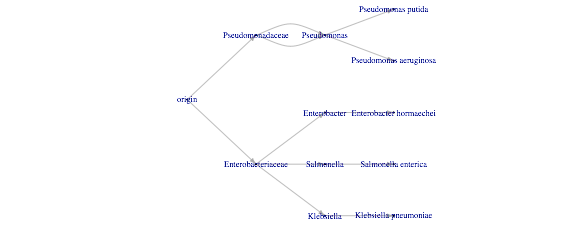
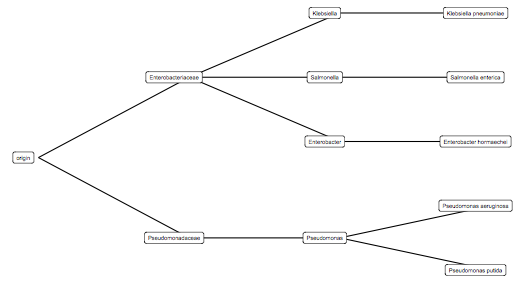
I was able to convert the class.data to a dataframe and then into a parent-child dataframe to use it as input for the ggraph. The only thing left is having the xlabel, in this case the interest vector. However I'm not sure if that's possible in ggraph:
# Retreive data
class.dat <- classification(c("Pseudomonas putida", "Pseudomonas aeruginosa","Enterobacter xiangfangensis","Salmonella enterica","Klebsiella pneumoniae"), db = 'ncbi')

# Specify interest
interest <- c('superkingdom', 'phylum','class','order','genus','species')

# Convert to wide matrix
df2 <- bind_rows(class.dat, .id = "column_label") %>%
  dplyr::select(-id) %>%
  filter(rank %in% interest) %>%
  spread(rank, name) %>%
  dplyr::select(-column_label) %>%
  dplyr::select(interest) %>% # we need the order
  as.matrix()

# Empty parent child matrix
parent.child <- matrix(nrow=0,ncol=2)

# Add data to parent child
for (i in 1:(ncol(df2)-1)){
  parent.child <- rbind(parent.child,df2[,c(i,i+1)])
}

# To dataframe and add colnmaes
parent.child <- as.data.frame(parent.child)
colnames(parent.child) <- c('from', 'to')

# Convert this to a ggraph
g <- graph_from_data_frame(parent.child)
ggraph(g,layout='dendrogram',circular=FALSE) +
  geom_edge_link() +
  geom_node_label(aes(label=names(V(g))),size=3,nudge_y=-0.1) +
  scale_y_reverse(labels = interest)  + coord_flip() +
  theme_classic()

dputof your data? – Primateshiptaxizeand thereby not explicitly show at whatranka species deviates – Proportioned