Librosa mel filter bank decreasing triangles
Asked Answered
U

4

6

I'm a bit stuck understanding MFCCs.

From what I have read the mel filter banks should be a series of triangles that get wider and their peaks are at the same place. Like this...

enter image description here

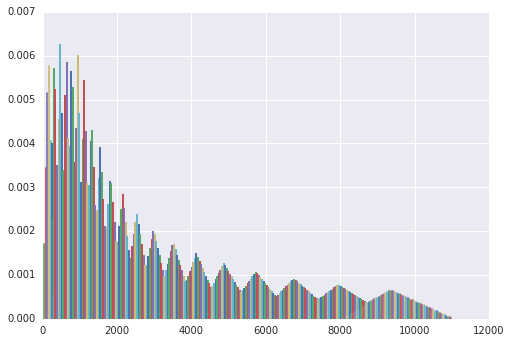
However when I compute the mel filter banks using librosa I get...

enter image description here

Code:

import librosa
import matplotlib.pyplot as plt

sr = 16000
mel_basis = librosa.filters.mel(sr=sr, n_fft=512, n_mels=10,fmin=0, fmax=sr / 2)
plt.plot(mel_basis)
Ustkamenogorsk answered 22/10, 2016 at 21:7 Comment(0)
U
10

I'm a bit more informed now and I feel like the answer given is not completely correct, so I think I should answer my own question.

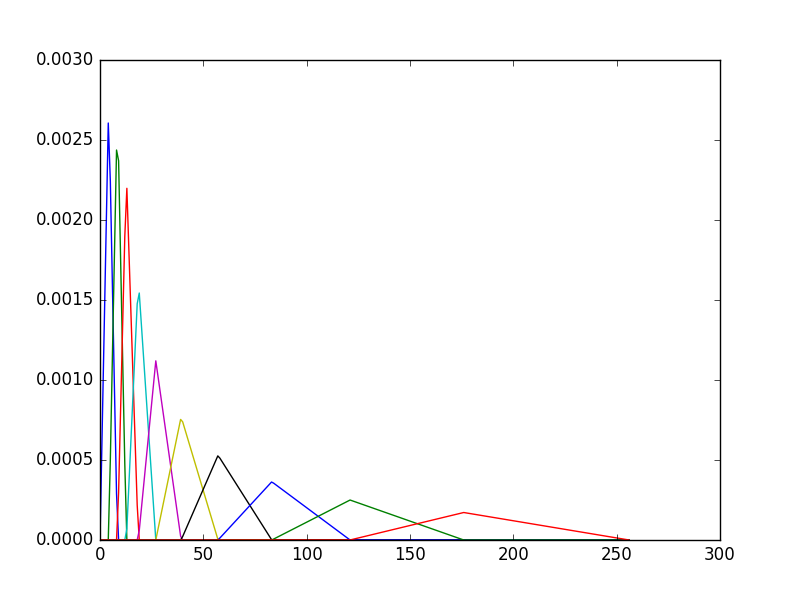
librosa.filters.mel returns a matrix with the shape (n_mels, n_fft/2 +1). This means each row in the matrix is a mel. The columns are the weight for each frequency for the mel filter bank. The frequency is in terms of cycles up to number of n_fft, we throw away half of them due to aliasing (nyquist theorem).

This means in order to plot the mels correctly the matrix needs to be transposed. As we effectively want N different plots where N is the number of mels.

plt.plot(mel.T)

This gives the following image: enter image description here

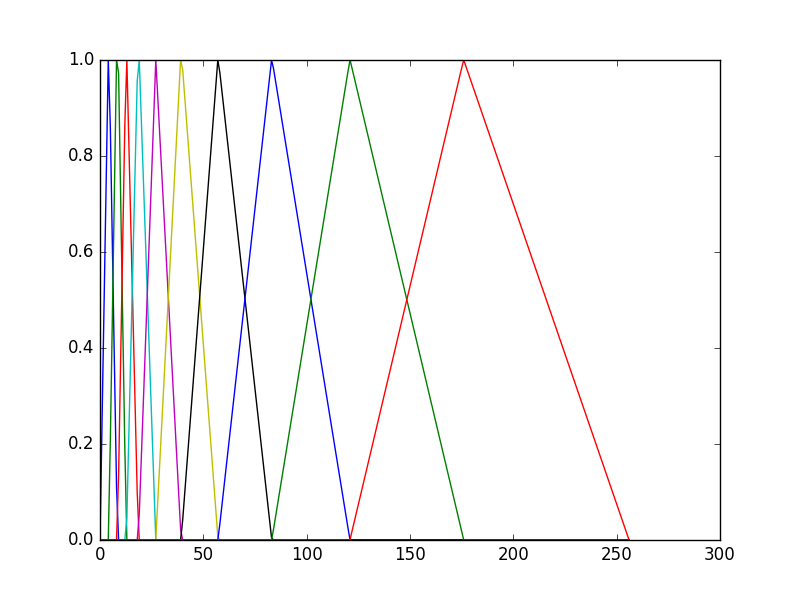
Note that this set of mel filter banks is still not what is expected. This is because the Librosa uses a normalised version of mel-filter banks, this means that each of the mels have an area of 1 instead of the traditional equal height of 1. The matrix returned from librosa can be transformed into the equal height mel-filter bank by:

mels /= np.max(mels, axis=-1)[:, None]

And then the plot looks like this:enter image description here

Ustkamenogorsk answered 17/5, 2017 at 16:18 Comment(0)
G
2

You're a missing the freq vector, each filter has nftt/2 +1 samples so the mel basis is a matrix of n_mels x (nfft/2 +1) in librosa.

In order to compute the MFCC you have to get the power spectrum of the framed signal an later you multiply it by the filter bank.

import numpy.matlib

sr = 22050
n_fft = 512
n = 10
mel_basis = librosa.filters.mel(sr=sr, n_fft=n_fft, n_mels=n,fmin=0, fmax=sr / 2)
f = np.linspace(0,sr/2,(n_fft/2)+1)
f_all = np.matlib.repmat(f, n,1)
plt.plot(f_all,mel_basis)
plt.show()

Librosa Mfcc Filter bank

If you prefer another plotting option could be with a for loop.

for i in range(n):
    plt.plot(f,mel_basis[i])
    plt.show()

Mfcc librosa

Gatehouse answered 10/4, 2017 at 21:16 Comment(0)
J
2

Well it's a bit late but I hope this answer will be helpful for anyone struggling with the different mel-filterbank implementations:

There are a few different implementations of mel-filterbanks; specifically librosa has 2 different: one from the Cambridge's Hidden Markov Model Toolkit (HTK) and the default one written by Slaney and implemented in Matlab's Auditory Toolbox:

The HTK generates a filterbank with all filters set with gain 1 at its center Slaney,s implementation generates a normalized filterbank, where the normalization could be done by area or by bandwidth.

Besides the fact that their effectiveness is quite similar, the filter values aren't the same, so I'm doubtful about changing the visualization could be useful.

Check this paper for further information about the compared performance of different mel-filterbak implementations

Jacquejacquelin answered 29/10, 2018 at 13:15 Comment(0)
T
0

You are searching "Mel-filter bank with same bank height". I am also searching for this. First the mels should be transposed, and just use the "norm" parameter, and change it to None.

mels = librosa.filters.mel(20000, 2048, n_mels=4, fmin=0.0, fmax=None, htk=False, norm=None)
plt.plot(mels.T)
plt.show()

mel picture

Teratogenic answered 28/10, 2020 at 3:59 Comment(0)

© 2022 - 2024 — McMap. All rights reserved.