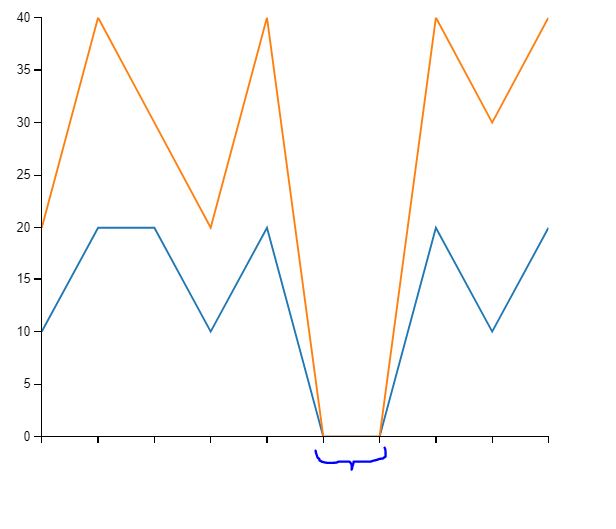
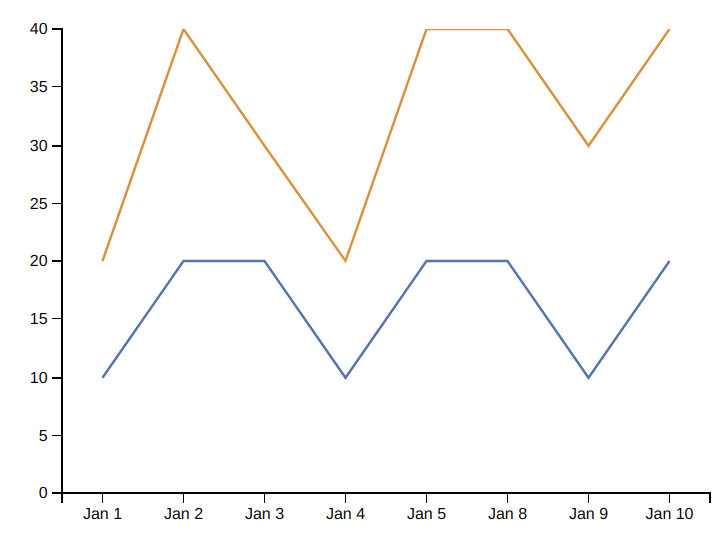
I have data for every date from Jan 2018 and I am creating a stacked line chart out of that data. Every weekend the count of my data is zero, so every weekend it shows a dip in my graph (as data reaches to zero). I want to avoid that dip. I have a Date column as well as a Day column. The Day column has values from 1 to 7 representing each day of week (1 is Monday and 7 is Sunday). Can I modify my x axis or graph to show only weekdays data?
var data = [
 { Type: 'T', Date: "2018-01-01", DocCount: 10, Day: 1},
 { Type: 'E', Date: "2018-01-01", DocCount: 10, Day: 1},
 ...
]

chart
.height(350)
.width(450)
.margins({top: 10, right: 10, bottom: 5, left: 35})
.dimension(dateDim)
.group(tGroup)
.stack(eGroup, "E")
.valueAccessor( function(d) {
    return d.value.count;
})
.transitionDuration(500)
.brushOn(false)
.elasticY(true)
.x(d3.time.scale().domain([minDateTime, maxDateTime]))
.xAxis().ticks(10).tickFormat(d3.format("s"));


d3.scale.ordinal()tod3.scaleOrdinal()but it is giving me error "unable to get property y of undefined or null reference", can you help me in this? – Panto