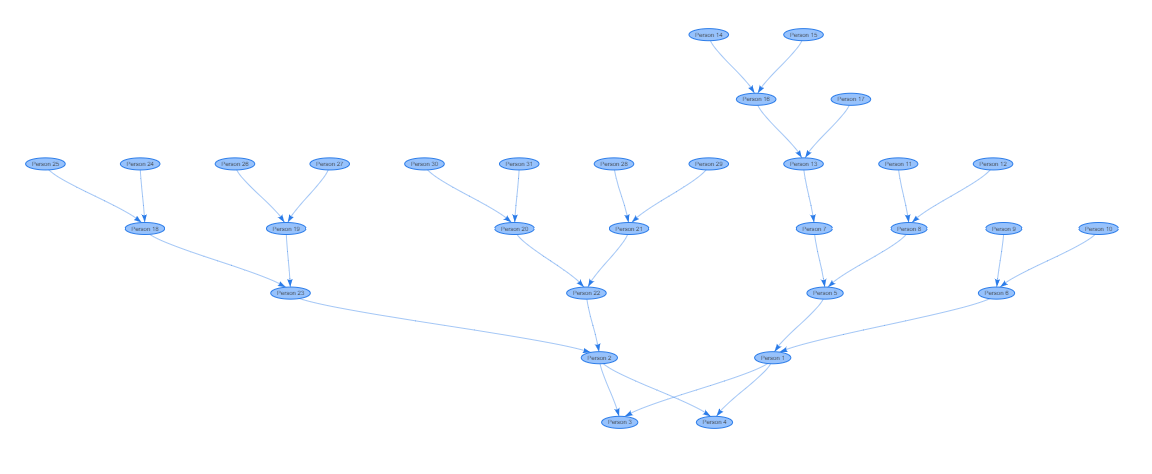
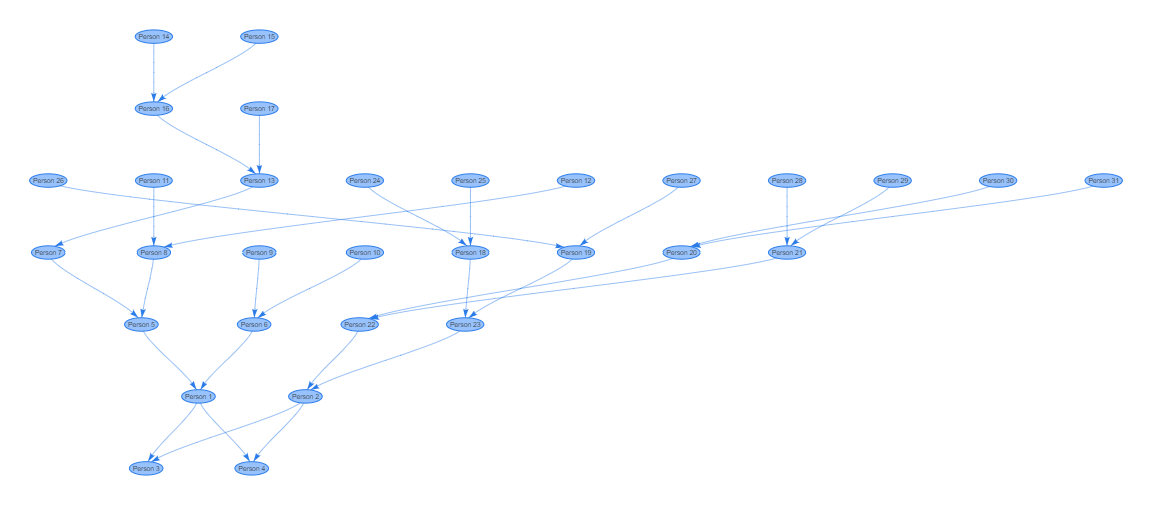
Problem: After switchnig to new (4.21) version of vis.js (from 4.18) my graph is all messed up.
EDIT: The change occurs between versions 4.19.1 and 4.20. I guess it has something to do with multiple changes in network introduced in the 4.20 version.
I'm building a family free. I spent some time to get a nice looking graph. Then I found out that new version of vis.js is available. Once I decided to use it, the edges of my graph started to cross.
Here's my nice-looking graph using 4.18.1:

Here's what happens if I change to 4.21.0:

What did I do wrong? How to fix this? Same data, same code. The only difference is:
<script type="text/javascript" src="https://cdnjs.cloudflare.com/ajax/libs/vis/4.21.0/vis.min.js"></script>
instead of
<script type="text/javascript" src="https://cdnjs.cloudflare.com/ajax/libs/vis/4.18.1/vis.min.js"></script>
Here's the 4.18.1 fiddle and 4.21.0 fiddle.
And a full code with 4.21.0 reference below:
    // create an array with nodes
    var nodes = new vis.DataSet([
		{id: 1, label: 'Person 1'},
		{id: 2, label: 'Person 2'},
		{id: 3, label: 'Person 3'},
		{id: 4, label: 'Person 4'},
		{id: 5, label: 'Person 5'},
		{id: 6, label: 'Person 6'},
		{id: 7, label: 'Person 7'},
		{id: 8, label: 'Person 8'},
		{id: 9, label: 'Person 9'},
		{id: 10, label: 'Person 10'},
		{id: 11, label: 'Person 11'},
		{id: 12, label: 'Person 12'},
		{id: 13, label: 'Person 13'},
		{id: 14, label: 'Person 14'},
		{id: 15, label: 'Person 15'},
		{id: 16, label: 'Person 16'},
		{id: 17, label: 'Person 17'},
		{id: 18, label: 'Person 18'},
		{id: 19, label: 'Person 19'},
		{id: 20, label: 'Person 20'},
		{id: 21, label: 'Person 21'},
		{id: 22, label: 'Person 22'},
		{id: 23, label: 'Person 23'},
		{id: 24, label: 'Person 24'},
		{id: 25, label: 'Person 25'},
		{id: 26, label: 'Person 26'},
		{id: 27, label: 'Person 27'},
		{id: 28, label: 'Person 28'},
		{id: 29, label: 'Person 29'},
		{id: 30, label: 'Person 30'},
		{id: 31, label: 'Person 31'},
    ]);
    // create an array with edges
    var edges = new vis.DataSet([
		{from: 1, to: 5, arrows:'from'},
		{from: 2, to: 23, arrows:'from'},
		{from: 3, to: 2, arrows:'from'},
		{from: 4, to: 2, arrows:'from'},
		{from: 5, to: 7, arrows:'from'},
		{from: 6, to: 9, arrows:'from'},
		{from: 7, to: 13, arrows:'from'},
		{from: 8, to: 11, arrows:'from'},
		{from: 13, to: 16, arrows:'from'},
		{from: 16, to: 14, arrows:'from'},
		{from: 18, to: 25, arrows:'from'},
		{from: 19, to: 26, arrows:'from'},
		{from: 20, to: 30, arrows:'from'},
		{from: 21, to: 28, arrows:'from'},
		{from: 22, to: 20, arrows:'from'},
		{from: 23, to: 18, arrows:'from'},
		{from: 1, to: 6, arrows:'from'},
		{from: 2, to: 22, arrows:'from'},
		{from: 3, to: 1, arrows:'from'},
		{from: 4, to: 1, arrows:'from'},
		{from: 5, to: 8, arrows:'from'},
		{from: 6, to: 10, arrows:'from'},
		{from: 8, to: 12, arrows:'from'},
		{from: 13, to: 17, arrows:'from'},
		{from: 16, to: 15, arrows:'from'},
		{from: 18, to: 24, arrows:'from'},
		{from: 19, to: 27, arrows:'from'},
		{from: 20, to: 31, arrows:'from'},
		{from: 21, to: 29, arrows:'from'},
		{from: 22, to: 21, arrows:'from'},
		{from: 23, to: 19, arrows:'from'},
	]);

    // create a network
    var container = document.getElementById('mynetwork');

    // provide the data in the vis format
    var data = {
        nodes: nodes,
        edges: edges
    };

	var options = {
		layout: {
			hierarchical: {
				enabled: true,
				//levelSeparation: 130,
				nodeSpacing: 220,
				blockShifting: false,
				parentCentralization: false,
				edgeMinimization: true,
				direction: 'DU',
				sortMethod: 'directed',
			},
		},
		edges: {
			smooth: {
				type: "cubicBezier",
				forceDirection: 'vertical',
				roundness: 0.25
			},
		},
		physics: false,
	}

    // initialize your network!
    var network = new vis.Network(container, data, options);
<script src="https://cdnjs.cloudflare.com/ajax/libs/vis/4.21.0/vis.min.js"></script>
<body>
<div id="mynetwork"></div>
</body>