How to display the value (sum) rather than count of markers in a dc.leaflet.js
Asked Answered
G

2

2

I want to use crossfilter's reduceSum function dc.leaflet.js, and display the sum instead of the number of clustered markers.

The first example for dc.leaflet.js uses reduceCount. Additionally it doesn't use the reduced value; it just displays the number of markers in the cluster.

I want to use the sum of data using reduceSum.

Here is my data as tsv:

type geo say
wind 38.45330,28.55529 10
solar 39.45330,28.55529 10

Here is my code:

<script type="text/javascript" src="../js/d3.js"></script>
<script type="text/javascript" src="../js/crossfilter.js"></script>
<script type="text/javascript" src="../js/dc.js"></script>
<script type="text/javascript" src="../js/leaflet.js"></script>
<script type="text/javascript" src="../js/leaflet.markercluster.js"></script>
<script type="text/javascript" src="../js/dc.leaflet.js"></script>


<script type="text/javascript">
    /*     Markers      */

d3.csv("demo1.csv", function(data) {
  drawMarkerSelect(data);
});

function drawMarkerSelect(data) {
  var xf = crossfilter(data);

    var facilities = xf.dimension(function(d) { return d.geo; });
    var facilitiesGroup = facilities.group().reduceSum(function(d){return d.say});

  dc.leafletMarkerChart("#demo1 .map")
      .dimension(facilities)
      .group(facilitiesGroup)
      .width(1100)
        .height(600)
      .center([39,36])
      .zoom(6)
      .cluster(true);  

    var types = xf.dimension(function(d) { return d.type; });
    var typesGroup = types.group().reduceSum(function(d){return d.say});    


  dc.pieChart("#demo1 .pie")
      .dimension(types)
      .group(typesGroup)
      .width(200) 
        .height(200)
        .renderLabel(true)
        .renderTitle(true)
      .ordering(function (p) {
        return -p.value;
      });

    dc.renderAll();
} 


</script>
Gwendagwendolen answered 15/12, 2014 at 15:2 Comment(1)
Gordon has identified the most significant issue of your data being tab-seperated values, but the d3.csv() in your example above is looking for comma-seperated values. Sidenote: Have you checked to see if the values are numbers vs strings?Remora
L
2

I have rewritten the question because it was very unclear. I agree with @Kees that the intention was probably to display the sum in a clustered marker chart, rather than "reduceSum doesn't work".

@Kees also pointed out a Leaflet.markercluster issue which gives basic information about how to display a sum inside a marker cluster.

The question becomes, how to apply these customizations to dc.leaflet.js?

First, I've created a version of the example data with another column rnd:

type    geo rnd
wind    43.45330,28.55529   1.97191
wind    43.44930,28.54611   3.9155
wind    43.45740,28.54814   3.9922
...

We can use reduceSum like this:

  var facilitiesGroup = facilities.group().reduceSum(d => +d.rnd);

And annotate each marker with its value by overriding .marker(), wrapping the default callback:

  const old_marker_function = marker.marker();
  marker.marker(function(d, map) {
    const m = old_marker_function(d, map);
            m.value = d.value;
    return m;
  });

And we can specify a different rendering of the icon using .clusterOptions():

  marker.clusterOptions({
    iconCreateFunction: function(cluster) {
      var children = cluster.getAllChildMarkers();
        var sum = 0;
        for (var i = 0; i < children.length; i++) {
        sum += children[i].value;
      }
      sum = sum.toFixed(0);
      var c = ' marker-cluster-';
      if (sum < 10) {
        c += 'small';
      } else if (sum < 100) {
        c += 'medium';
      } else {
        c += 'large';
      }
      return new L.DivIcon({ html: '<div><span>' + sum + '</span></div>', className: 'marker-cluster' + c, iconSize: new L.Point(40, 40) });
    }
  });

The example given in the above issue was missing any styling, so I copied the implementation of _defaultIconCreateFunction from the Leaflet.markercluster sources, and modified it.

number clusters Demo fiddle

As expected, the numbers are close to 2.5 times the original numbers (since the new column is a random number from 0 to 5).

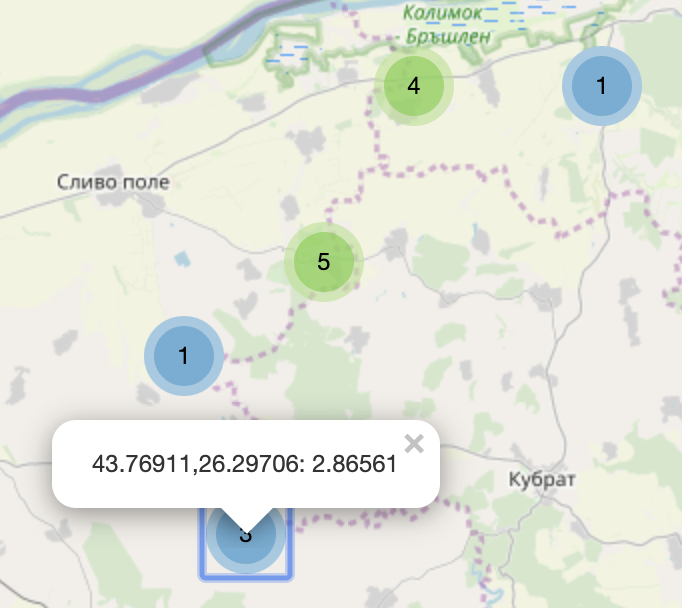
Putting numbers on the individual markers

marker.icon() allows you change the icon for individual markers, so you can use DivIcon with similar styling to display the numbers:

  marker.icon(function(d, map) {
    return new L.DivIcon({
      html: '<div><span>' + d.value.toFixed(0) + '</span></div>',
      className: 'marker-cluster-indiv marker-cluster',
      iconSize: new L.Point(40, 40) });
  });

This introduces a new class .marker-cluster-indiv to distinguish it from the others; in the new fiddle I've colored them blue with

.marker-cluster-indiv {
    background-color: #9ecae1;
}
.marker-cluster-indiv div {
    background-color: #6baed6;
}

with blue individuals

The interaction is perhaps less clear since clicking blue dots brings up a popup instead of expanding. Perhaps a different icon should be used.

Leroylerwick answered 23/3, 2020 at 14:10 Comment(2)
Thanks again Gordon, really nice work and also fast. The extra for determing the icon is really nice too. I am trying to find a solution for the limitation you already mentioned but hopefully you have some spare time left to find a solution for this. Really appreciated the time you already spend on this and how it looks!Joacima
okay, added individuals in blue. hopefully this makes it clear how to do more customizations if needed.Leroylerwick
L
0

The reduceSum part should work fine, since that is just a different crossfilter function.

Are you sure that your data is getting read correctly? You state that it is a tsv file, and show code that looks like it is tab-separated, but then you use d3.csv to load it, which would have pretty bad effects considering there is a comma in the middle of the second field.

Please try console.log(data) after your data is loaded, and verify that it is loading correctly.

Also, you do not state what problem you encounter. "It doesn't work" does not help us help you.

Leroylerwick answered 15/12, 2014 at 21:57 Comment(11)
I am having the same problem. What coder1 means is that for the value of the marker, leallet only looks to the geo data points and not the value that is giving to this point. In the above example you would see in the marker if you zoom out 2 (two different data points). But what you want is that it takes the value of the column "say". In above example 30. But this is not possible with reduceSum. Hopefully you can help us!Joacima
What do you want to do with the value? dc.leaflet.js has a bubble chart, is this what you’re looking for? I still don’t see the difference between reduceCount and reduceSum in this situation - a marker can’t display value either way.Leroylerwick
Hi Gordon, the first example in the link you send is the value in the marker of the bubble chart based on Geo location and not a value from a specific column. In this link the same question is asked but i really don't know how to implement this in the above example. gis.stackexchange.com/questions/241158/…Joacima
I see, you are talking about the marker cluster except you want to display the value as a number within the icon, instead of the count of markers. Do you want the clustering feature? BTW, this question is >5 years old and not very well written; in the future it would probably be better to ask a new question (although I'm happy to answer here if I have time).Leroylerwick
Many thanks Gordon, really appreciated. Yes i still want the clustering but as you mentioned based on the value of a column. I am trying to make a jsfiddle for you so it's probably easier to change the code.Joacima
It's okay, I am on it.Leroylerwick
I don't know how to load local data from d3. But if you manage to get it working then you can use this example: jsfiddle.net/Pension007/wb6vehfg/1 With a local csv file it is working. Thanks again for you help!Joacima
Alright, I edited the question because I think your interpretation must be correct, and I have added an answer with demo fiddle.Leroylerwick
Again clear explanation and solution. Also with the creation of a new class for the markers. Hopefully you can help me with one additional question. I have added in the following example also a reduceSum on the group of the Pie chart. Furthermore i keep two geo data points. In the first geo data point i have two types (wind and solar) with a value. The second geo data point is with one type. The sum works for the pie chart and the value in the markers.Joacima
If you click in the map on the blue marker of the first geo data point the pie chart is correctly filtered (wind and solar are shown with the correct values). But if click in the Pie chart on type "Solar" the Pie chart filters only the geo points that has no type "Solar" and shows in the marker on the map the value 4 (Solar + Wind). Is there a way to add this in the marker declaration? Or can you do this with the crossfilter functionality? Thanks again for all your help so far! jsfiddle.net/Pension007/ptLznrao/3Joacima
Not sure I understand. Is this related to the current question? If not, please ask a new question.Leroylerwick

© 2022 - 2024 — McMap. All rights reserved.