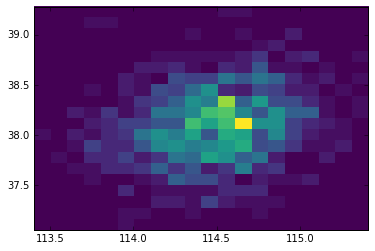
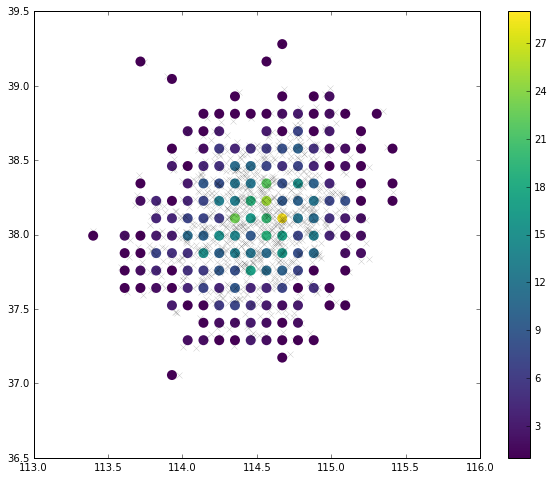
I have figured out a method to cluster disperse point data into structured 2-d array(like rasterize function). And I hope there are some better ways to achieve that target.
My work
1. Intro
- 1000 point data has there dimensions of properties (lon, lat, emission) whicn represent one factory located at (x,y) emit certain amount of CO2 into atmosphere
- grid network: predefine the 2-d array in the shape of 20x20
http://i4.tietuku.com/02fbaf32d2f09fff.png
The code reproduced here:
#### define the map area
xc1,xc2,yc1,yc2 = 113.49805889531724,115.5030664238035,37.39995194888143,38.789235929357105
map = Basemap(llcrnrlon=xc1,llcrnrlat=yc1,urcrnrlon=xc2,urcrnrlat=yc2)

#### reading the point data and scatter plot by their position
df = pd.read_csv("xxxxx.csv")
px,py = map(df.lon, df.lat)
map.scatter(px, py, color = "red", s= 5,zorder =3)

#### predefine the grid networks
lon_grid,lat_grid = np.linspace(xc1,xc2,21), np.linspace(yc1,yc2,21)
lon_x,lat_y = np.meshgrid(lon_grid,lat_grid)
grids = np.zeros(20*20).reshape(20,20)
plt.pcolormesh(lon_x,lat_y,grids,cmap =  'gray', facecolor = 'none',edgecolor = 'k',zorder=3)
2. My target
- Finding the nearest grid point for each factory
- Add the emission data into this grid number
3. Algorithm realization
3.1 Raster gridnote: 20x20 grid points are distributed in this area represented by blue dot.
http://i4.tietuku.com/8548554587b0cb3a.png
3.2 KD-treeFind the nearest blue dot of each red point
sh = (20*20,2)
grids = np.zeros(20*20*2).reshape(*sh)

sh_emission = (20*20)
grids_em = np.zeros(20*20).reshape(sh_emission)

k = 0
for j in range(0,yy.shape[0],1):
    for i in range(0,xx.shape[0],1):
        grids[k] = np.array([lon_grid[i],lat_grid[j]])
        k+=1

T = KDTree(grids)

x_delta = (lon_grid[2] - lon_grid[1])
y_delta = (lat_grid[2] - lat_grid[1])
R = np.sqrt(x_delta**2 + y_delta**2)

for i in range(0,len(df.lon),1):
    idx = T.query_ball_point([df.lon.iloc[i],df.lat.iloc[i]], r=R)
    # there are more than one blue dot which are founded sometimes,
    # So I'll calculate the distances between the factory(red point)
    # and all blue dots which are listed
    if (idx > 1):
        distance = []
        for k in range(0,len(idx),1):
            distance.append(np.sqrt((df.lon.iloc[i] - grids[k][0])**2 + (df.lat.iloc[i] - grids[k][1])**2))
           pos_index = distance.index(min(distance))
           pos = idx[pos_index]

    # Only find 1 point
    else:
         pos = idx
    grids_em[pos] += df.so2[i]
4. Result
co2 = grids_em.reshape(20,20)
plt.pcolormesh(lon_x,lat_y,co2,cmap =plt.cm.Spectral_r,zorder=3)
http://i4.tietuku.com/6ded65c4ac301294.png
5. My question
- Can someone point out some drawbacks or error of this method?
- Is there some algorithms more aligned with my target?
Thanks a lot!


j = N * (lat - lat_min) / (lat_max - lat_min)and the same fori. – Archivist