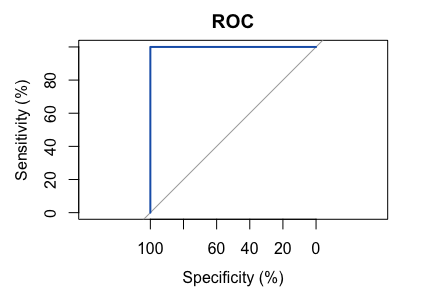
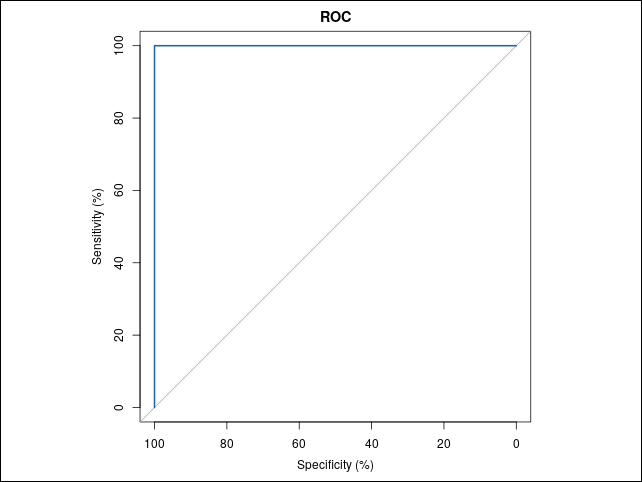
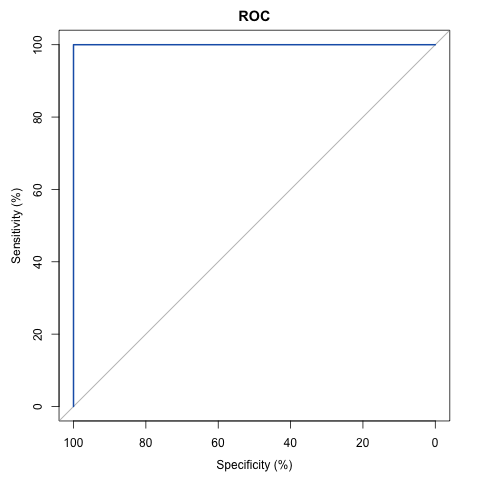
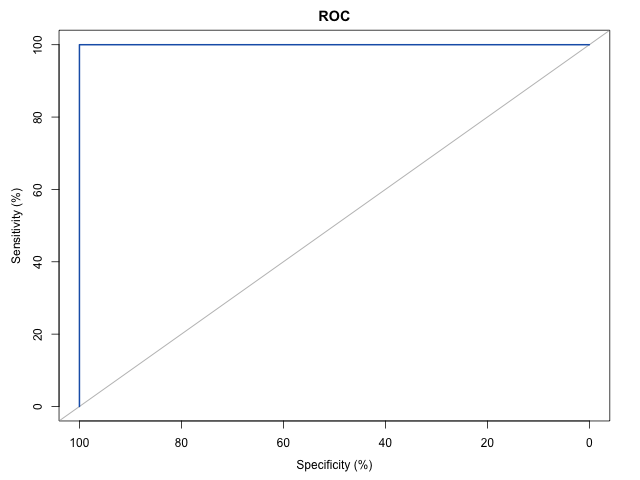
I want to draw ROC curves with pRoC. However for some reason there is extra empty space on either side of the x-axis and I cannot remove it with xlim. Some example code:
library(pROC)
n = c(4, 3, 5)
b = c(TRUE, FALSE, TRUE)
df = data.frame(n, b)
rocobj <- plot.roc(df$b, df$n, percent = TRUE, main="ROC", col="#1c61b6", add=FALSE)
I tried the pROC help file, but that doesn't really help me. Even more puzzling is to me that the Y-axis is OK looking...
I really appreciate your help!


