the issue is as you are doing 'full' correlation, the algorithm add zeros to complete the vectors. which mean that you will have the highest value when both signal are align in the convolution
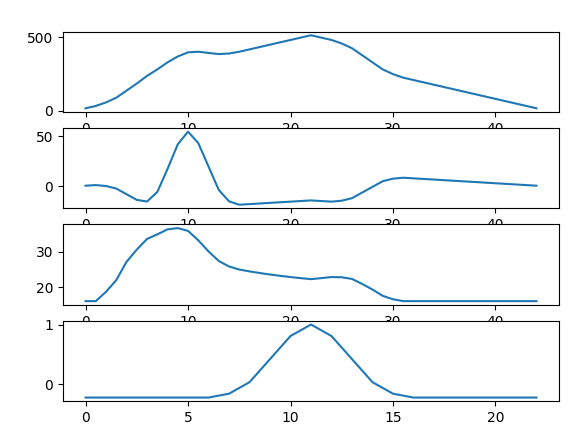
here both example with and without the mean suppression
import numpy as np
from scipy import signal
import matplotlib.pyplot as plt
x = np.array([4,4,4,4,6,8,10,8,6,4,4,4,4,4,4,4,4,4,4,4,4,4,4])
y = np.array([4,4,4,4,4,4,4,4,4,4,4,4,4,4,4,4,6,8,10,8,6,4,4])

correlation = signal.correlate(x, y, mode="full")
lag =  np.argmax(correlation) - len(x)
plt.figure()
plt.subplot(411)
plt.plot(correlation)

plt.subplot(412)
correlation = signal.correlate(x-x.mean(), y-y.mean(), mode="full")
lag =  np.argmax(correlation) - len(x)
plt.plot(correlation)

plt.subplot(413)
correlation_f = signal.correlate(np.ones(x.shape), np.ones(y.shape), mode="full")
correlation = signal.correlate(x, y, mode="full")/correlation_f
plt.plot(correlation)


plt.subplot(414)

corr = np.zeros(x.shape)
for i in range(len(x)):
    y2 = np.roll(y, i)
    corr[i] = np.corrcoef(x,y2)[0,1]
print(np.argmax(corr))
plt.plot(corr)
plt.show()
![enter image description here]()
Usually the correlation allows to find a small signal in a longer signal where this issue is negligible.
You can try to compensate with the size of overlapping between signal like in the third plot. But it is not perfect.
the mean suppression would not work in all cases.
if you have the same exact signal that have been rolled then you can tried what I put in the fourth row where you roll the first signal and look when you have a maximum of correlation. This could be the best option for you. But it works only if both signal are the same just rolled by a shift number.

