I want to profile my test application started by IntelliJ. For profiling I use VisualVM.
I started the Java tool with the parameter -J-Dorg.netbeans.profiler.separateConsole=true.
I started the application with the VM parameter -Xverify:none, otherwise VisualVM throws an error if I start profiling (Redefinition failed with error 62).
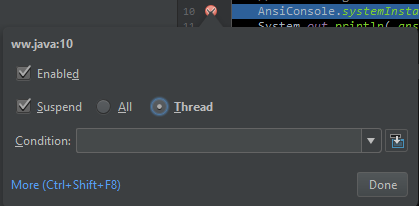
I want to profile my application before any important code has been executed, so I tried to set a break point and start profiling in VisualVM. The problem is that VisualVM doesn't respond to any interaction while I'm waiting at my break point. Do I miss something?
In normal execution (without debugging) my program waits for input, so I can profile it without debugging. But what if a program doesn't has such "waiting points"?
My test application looks like that:
package my.visualvm.example;

import java.util.Scanner;

public class MainClass {

    public static void main(String[] args) {

        System.out.println("Starting Application: " + MainClass.class.getSimpleName());

        Scanner scanner = new Scanner(System.in);

        while (scanner.hasNext()) {
            double value = scanner.nextDouble();
            if (value == 0d) {
                break;
            }
            System.out.println(Powa.powaPowa(value));
        }

        System.out.println("Stopping Application: " + MainClass.class.getSimpleName());
    }

}
Other class:
package my.visualvm.example;

final class Powa {

    private Powa() {
    }

    static double powaPowa(double powa) {
        return Math.pow(powa, 2);
    }
}

