How do I add a comma separator to a text label in geom_text?
Asked Answered
G

2

6

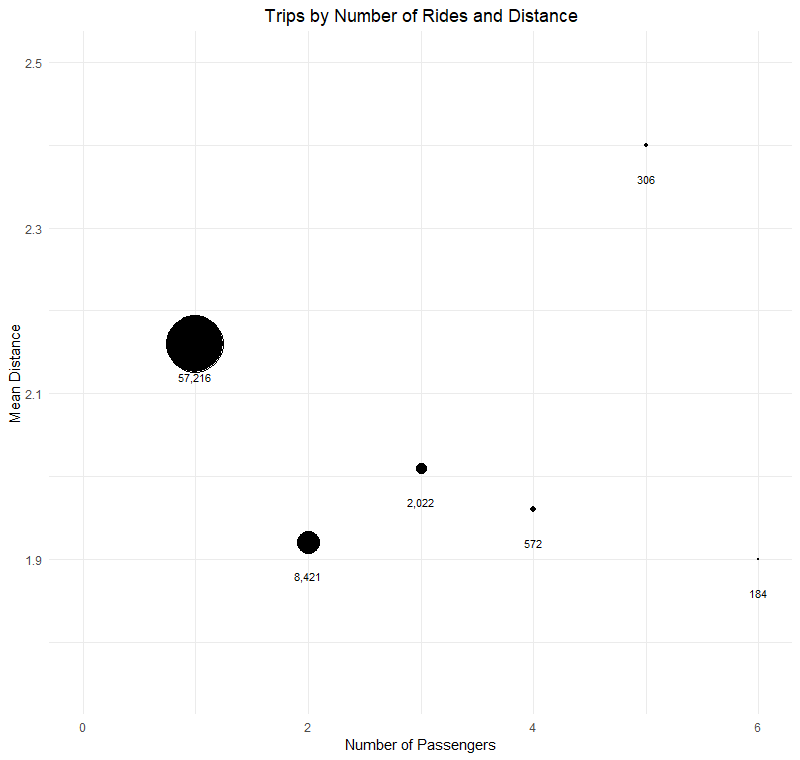
I need to change the number format in geom_text() to include a comma.

I have seen the related questions and I can't get those solutions to work. I've tried the "sep =" one, the count/sum(count) kind, and some other code I just transcribed without knowing what anything meant. I need a lifeline here before this makes me crazy.

Here's my data:

 N_PASSENGERS Count Mean_Dist Mean_Time Mean_Fare
         <int> <int>     <dbl>     <dbl>     <dbl>
1            1 57216      2.16     10.2       145.
2            2  8421      1.92      9.21      213.
3            3  2022      2.01      9.67      234.
4            4   572      1.96      9.22      351.
5            5   306      2.40      9.84      505.
6            6   184      1.90      7.63      446.

ggplot(Difference, aes(x = N_PASSENGERS, y = Mean_Dist, size = Count)) + 
  geom_point() + 
  scale_size(range = c(0, 20)) + 
  xlim(0, 6) + 
  ylim(1.75, 2.5) + 
  geom_text(aes(label = Count), 
            size = 3, vjust = 4.2, 
            WHAT THE HELL GOES HERE TO MAKE SOME COMMAS HAPPEN?) +
  theme_minimal() + 
  theme(legend.position = "none") + 
  labs(x = "Number of Passengers", 
       y = "Mean Distance",
       title = "Trips by Number of Rides and Distance") + 
  theme(plot.title = element_text(hjust = .5))

I would like to see numbers like 10,000 next to my data point. Instead I see numbers like 10000. I appreciate that this is a childishly simple question. I am trying to teach myself R so I appreciate any help with this.

Georama answered 7/6, 2019 at 8:37 Comment(1)
That worked perfectly. Thank you so much for taking the time to help!Georama
T
3

You can use the scales package, that allows some formatting options like comma, dollar or percent.

df <- data.frame(a=c("a","b","c","d"), b=c(300,1000,2000,4000))
library(ggplot2)
library(scales)
ggplot(df, aes(a, b)) + 
  geom_point(size=4) +
  scale_y_continuous(labels = comma)

plot

Transmute answered 7/6, 2019 at 9:57 Comment(3)
The scales package is the answer. Thank you very much for taking the time to help me with that. I really appreciate it.Georama
@jon-robinson you are welcome. Please accept it as an answer and upvote it. thanksTransmute
This answer is useful too, because once I get the commas into the geom_text, I notice I also want them in the y-axis labels!Mintun
S
12

You can format your text labels within the aesthetic mapping aes() in geom_text.

Instead of:

  ... +
  geom_text(aes(label = Count), size = 3, vjust = 4.2) +
  ...

Use:

  ... +
  geom_text(aes(label = scales::comma(Count)), size = 3, vjust = 4.2) +
  ...

Full data & code:

Difference <- read.table(text = "
                         N_PASSENGERS Count Mean_Dist Mean_Time Mean_Fare
                         1            1 57216      2.16     10.2       145.
                         2            2  8421      1.92      9.21      213.
                         3            3  2022      2.01      9.67      234.
                         4            4   572      1.96      9.22      351.
                         5            5   306      2.40      9.84      505.
                         6            6   184      1.90      7.63      446.")

ggplot(Difference, aes(x = N_PASSENGERS, y = Mean_Dist, size = Count)) + 
  geom_point() + 
  scale_size(range = c(0, 20)) + 
  xlim(0, 6) + 
  ylim(1.75, 2.5) + 
  geom_text(aes(label = scales::comma(Count)), 
            size = 3, vjust = 4.2) +
  theme_minimal() + 
  theme(legend.position = "none") + 
  labs(x = "Number of Passengers", 
       y = "Mean Distance",
       title = "Trips by Number of Rides and Distance") + 
  theme(plot.title = element_text(hjust = .5))

plot

Shellishellie answered 7/6, 2019 at 10:29 Comment(1)
This should be the accepted answer. It answers the actual question! I needed the comma in the geom_text(), not in the y axis numbers (which my theme hides). Thank you!Duvalier
T
3

You can use the scales package, that allows some formatting options like comma, dollar or percent.

df <- data.frame(a=c("a","b","c","d"), b=c(300,1000,2000,4000))
library(ggplot2)
library(scales)
ggplot(df, aes(a, b)) + 
  geom_point(size=4) +
  scale_y_continuous(labels = comma)

plot

Transmute answered 7/6, 2019 at 9:57 Comment(3)
The scales package is the answer. Thank you very much for taking the time to help me with that. I really appreciate it.Georama
@jon-robinson you are welcome. Please accept it as an answer and upvote it. thanksTransmute
This answer is useful too, because once I get the commas into the geom_text, I notice I also want them in the y-axis labels!Mintun

© 2022 - 2025 — McMap. All rights reserved.