I have a ggplot object. I would like to add some text with annotate(), and I would like to specify the coordinates of the text in npc units. Is this possible?
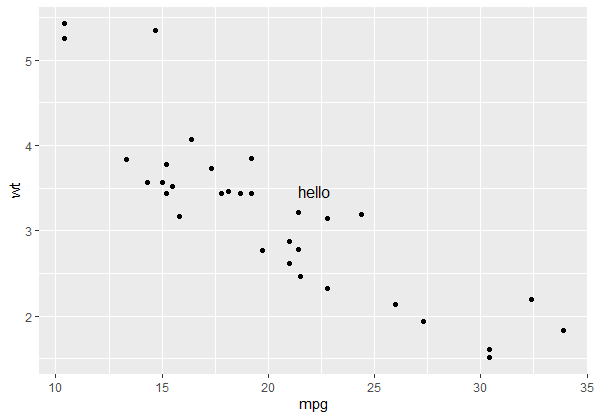
This minimal example demonstrates how text is ordinarily positioned with annotate():
library(ggplot2)
p <- ggplot(mtcars, aes(mpg, wt)) + geom_point()
p + annotate("text", x = 30, y = 4.5, label = "hello")
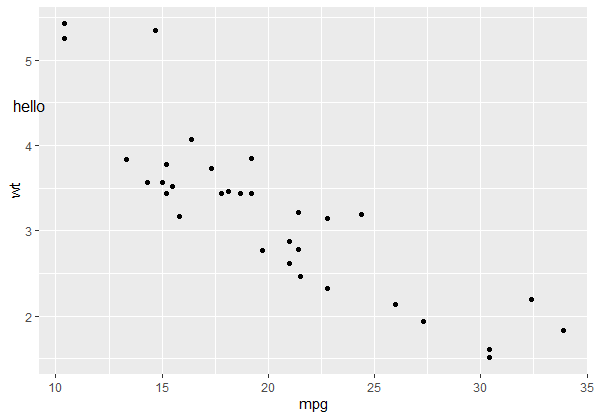
I would like to achieve the same effect, but instead of specifying x and y in native coordinates, I would like to specify them with npc coordinates. For the purpose of this example, I am not worried about exactly translating x = 30 and y = 4.5 into npc units. I just want to know whether npc units can be used in annotate() at all.
There are two related strategies, but they're not entirely satisfactory:
One can use npc units by specifying them to, say,
grid::textGrob(). And one can then place the grob withannotation_custom(), as in this answer by @baptiste. But this solution is a bit more cumbersome than I would like.The "ggpmisc" package includes
geom_text_npc(). But it doesn't yet work withannotate(). That is,annotate("text_npc", ...)doesn't seem to work. [Edit: it now works. See Pedro Aphalo's message below.]
There are also many related posts. In particular, Greg Snow has suggested using grid to create a viewport with the dimensions of p and then annotating that viewport. And @teunbrand has suggested a method that entails converting p to a "gtable" object (with ggplotGrob()) and then drawing that "gtable" object. Either of these strategies can probably be adapted to my purposes. But is there a more straightforward way to use npc coordinates with annotate()?


annotate()to package 'ggpmisc'. This newannotate()overrides the original definition adding support for the npcx and npcy position aesthetics. I will submit to CRAN in a few days. Meanwhile the code is available from Bitbucket (just be aware that for historical reasons the current main branch is called "no-debug"). This makesannotate("text_npc", ...)usable. – Buncombe