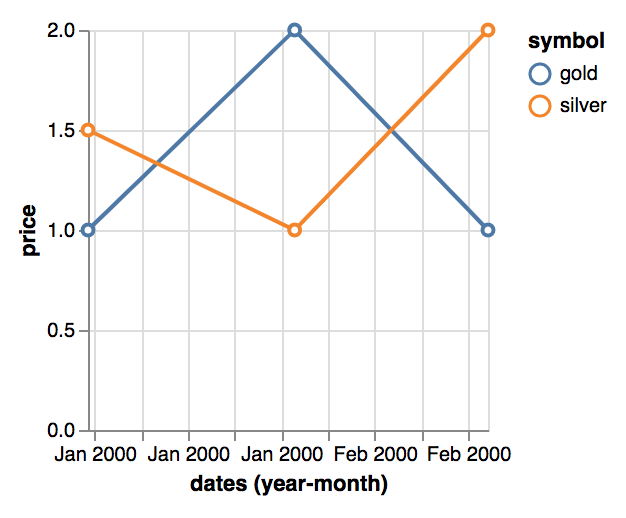
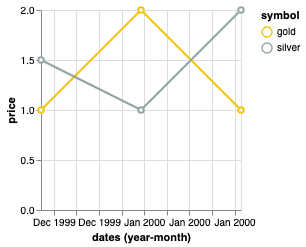
VegaLite assigns colors automatically. The Gold prices are Blue, and Silver prices are Orange, which feels wrong.
How can I assign explicit colours - #F1C40F for Gold and #95A5A6 for Silver?
I also would like to keep the data.values as in the example code below - as a set of separate arrays.
Code and Playground
{
  "$schema": "https://vega.github.io/schema/vega-lite/v4.json",
  "description": "Stock prices of 5 Tech Companies over Time.",
  "data": {
    "values": [
      {
        "dates": ["2000-01", "2000-02", "2000-03"],
        "gold": [1, 2, 1],
        "silver": [1.5, 1, 2]
      }
    ]
  },
  "transform": [
    {"flatten": ["dates", "gold", "silver"]},
    {"fold": ["gold", "silver"], "as": ["symbol", "price"]},
    {"calculate": "datetime(datum.dates)", "as": "dates"}
  ],
  "mark": {"type": "line", "point": {"filled": false, "fill": "white"}},
  "encoding": {
    "x": {"field": "dates", "type": "temporal", "timeUnit": "yearmonth"},
    "y": {"field": "price", "type": "quantitative"},
    "color": {"field": "symbol", "type": "nominal"}
  }
}


