How to plot reverse (complementary) ecdf using ggplot?
Asked Answered
B

3

6

I currently use stat_ecdf to plot my cumulative frequency graph.

Here is the code I used

    cumu_plot <- ggplot(house_total_year, aes(download_speed, colour = ISP)) + 
                 stat_ecdf(size=1)

However I want the ecdf to be reversed(complementary ecdf). Any ideas of the easiest way to do this?

Cheers!

Belton answered 14/5, 2016 at 0:49 Comment(2)
does setting stat_ecdf(size=1, mapping=aes(-download_speed)) work?Businesswoman
It doesn't work the way I want :(. What I want is the value of the y axis to be (1-y) instead of y, so when looking at the plot we can get the information on '...% of the sample has .... or more' instead of '....% of the sample has .... or less'Belton
B
0

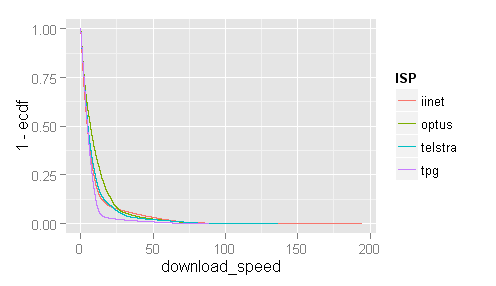
Since seems like there's no easier way to plot the inverse ecdf, here is what I've done in case someone is looking for a solution:

  1. extract the information from ecdf function and store it in the new column

    house_total_year_ecdf <- ddply(house_total_year, c("ISP"), mutate,
          ecdf = ecdf(download_speed)(unique(download_speed))*length(download_speed))
    
    #transforming the scale to (0,1)
    house_total_year_ecdf_2 <- ddply(house_total_year_ecdf, "ISP", mutate, 
          ecdf =scale(ecdf,center=min(ecdf),scale=diff(range(ecdf))))
    
  2. Plot the graph using geom_step and with y = 1-ecdf

    ggplot(house_total_year_ecdf_2, aes(download_speed,1-ecdf, colour = ISP)) +
    geom_step()
    

enter image description here

Belton answered 14/5, 2016 at 2:23 Comment(0)
A
19

From the help page of stat_ecdf:

Computed variables

x

x in data

y

cumulative density corresponding x

So this works:

p <- ggplot(dataframe_with_column_Z, aes(x=Z))

p + geom_line(aes(y = 1 - ..y..), stat='ecdf')

Output

Atbara answered 12/12, 2016 at 19:29 Comment(2)
Is there any way to pass a variable instead of the 1? I'm trying to use this to put the ecdf plot on a secondary y axis programmatically, such as aes(y = ..y.. * var), stat = 'ecdf')... getting an error when I input a variable, but not when I input the actual number. Thanks!Pretypify
This answer works well. For my use case though I needed to use geom_step rather than geom_line.Aideaidedecamp
B
0

Since seems like there's no easier way to plot the inverse ecdf, here is what I've done in case someone is looking for a solution:

  1. extract the information from ecdf function and store it in the new column

    house_total_year_ecdf <- ddply(house_total_year, c("ISP"), mutate,
          ecdf = ecdf(download_speed)(unique(download_speed))*length(download_speed))
    
    #transforming the scale to (0,1)
    house_total_year_ecdf_2 <- ddply(house_total_year_ecdf, "ISP", mutate, 
          ecdf =scale(ecdf,center=min(ecdf),scale=diff(range(ecdf))))
    
  2. Plot the graph using geom_step and with y = 1-ecdf

    ggplot(house_total_year_ecdf_2, aes(download_speed,1-ecdf, colour = ISP)) +
    geom_step()
    

enter image description here

Belton answered 14/5, 2016 at 2:23 Comment(0)
T
0

In your case, if you want to stick with that package you can add to aes():

y = 1 - ..y..

That is,

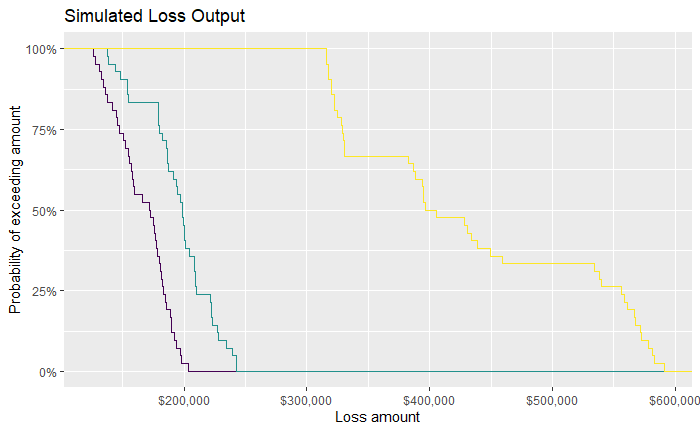
cumu_plot <- ggplot(house_total_year, aes(download_speed, colour = ISP, y = 1 - ..y..)) + stat_ecdf(size=1)

In my case I produced the following with:

ecdf_gg3 <- ggplot(sim_output_A.m, aes(x=loss, color=plan, y = 1 - ..y..)) +
  stat_ecdf(show.legend=FALSE) +
  labs(
    title="Simulated Loss Output",
    x = "Loss amount",
    y = "Probability of exceeding amount")+
  scale_x_continuous(labels = dollar_format())+
  scale_y_continuous(labels = percent_format()) +
  scale_fill_viridis(discrete=TRUE)+
  scale_color_viridis(discrete=TRUE)

enter image description here

Turpin answered 17/8, 2020 at 2:11 Comment(0)

© 2022 - 2024 — McMap. All rights reserved.