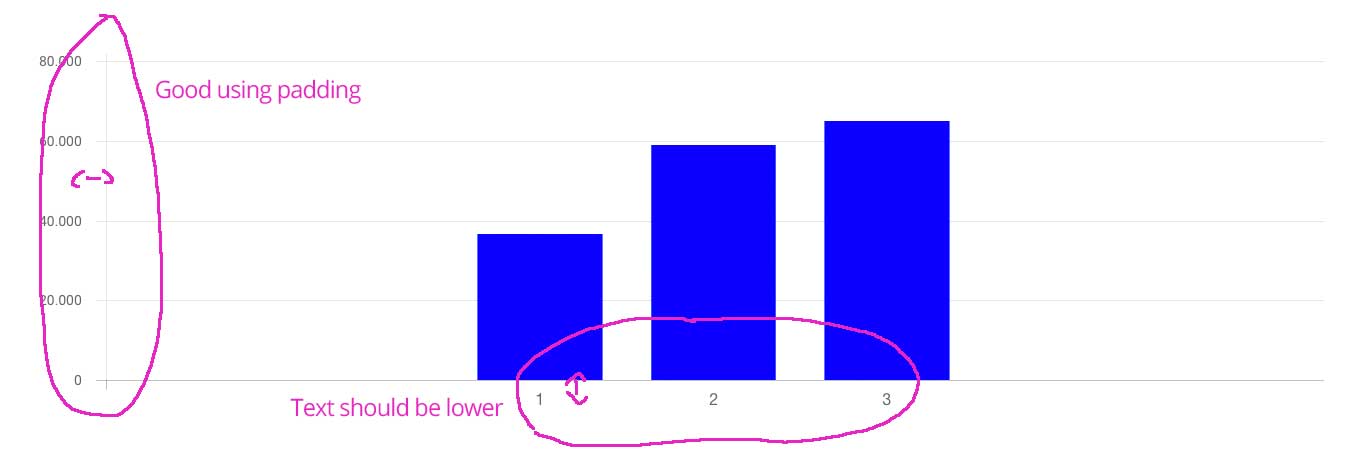
How to add padding to the vertical scale (X-axis) in Chart.js?
Asked Answered
C

5

6

According to the "Tick Configuration" of Chart.js version 2.3 it is only possible to set a padding for the ticks on the Y-axis ("horizontal scale"):

padding | Number |10 | Padding between the tick label and the axis. Note: Only applicable to horizontal scales.

And this works like a charm:

scales: {
    yAxes: [{
        ticks: {
            padding: 20,
        }
    }],
    xAxes: [{
        ticks: {
             // how to set padding here?
        }
    }]
}

But the draft says, that I need some padding on the X-axis as well

enter image description here

How can I achieve this using Chart.js?

Maybe it's possible using a plugin?

Cabot answered 9/11, 2016 at 21:9 Comment(4)
Were you able to get a solution for this? I'm in the same boat :-)Kratzer
@JesseSchutt Unfortunately not.Cabot
how did you accomplish the space between tick 1 and 2? @CabotJaela
@Cabot off-topic comment, but can you share your chart JS conf because I am trying to create the same chart.Hoopes
C
4

Add this to your options parameter:

options: {
   scales: {
       x: {
        ticks: {
           padding: 10
        }
    }
 }
Colston answered 30/11, 2022 at 21:30 Comment(1)
Your answer could be improved with additional supporting information. Please edit to add further details, such as citations or documentation, so that others can confirm that your answer is correct. You can find more information on how to write good answers in the help center.Tune
N
13

Late to the game here, but the solution with latest Chart.js is to include this in your options parameter:

{
  scales: {
    xAxes: [
      {
        ticks: {
          padding: 20
        }
      }
    ]
  }
}
Natiha answered 17/1, 2019 at 19:39 Comment(0)
C
4

Add this to your options parameter:

options: {
   scales: {
       x: {
        ticks: {
           padding: 10
        }
    }
 }
Colston answered 30/11, 2022 at 21:30 Comment(1)
Your answer could be improved with additional supporting information. Please edit to add further details, such as citations or documentation, so that others can confirm that your answer is correct. You can find more information on how to write good answers in the help center.Tune
E
2

Pass value to 'tickMarkLength' in options--> scales--> xAxes--> gridLines

xAxes: [{
  gridLines: {
   tickMarkLength: 10
},
Extracanonical answered 25/5, 2017 at 13:48 Comment(0)
P
1

The correct answer is the following for version 2.8:

options: {
    scales: {
        xAxes: [{
            ticks: {
                padding: 100
            }
        }], 
    }
}
Pinfeather answered 14/5, 2019 at 18:44 Comment(0)
M
-1

For echarts version 5:

grid: {
    left: '3%',
    right: '10%',
    bottom: '3%',
    containLabel: true
  },
Micronucleus answered 3/8, 2023 at 14:21 Comment(0)

© 2022 - 2024 — McMap. All rights reserved.