Generate a sequence of numbers between values of vector
Asked Answered
A

5

6

I have a vector of numbers

x <- c(2,5,1,6)

and I am trying to generate a sequence of values -- starting from 1 -- between and including the values in x so that I am left with the following string

1,2,3,4,5,4,3,2,1,2,3,4,5,6

I have tried to find the function I need to perform this task (e.g. seq, order, arrange) however I can't seem to find what I need to do this.

Arbour answered 24/4, 2017 at 14:46 Comment(6)
There should not be a 1 at the beginning, right?Ironbark
Using sample(x, replace = T) will generate numbers from the minimum and maximum range of x. Although, is that string the exact outcome you want generated? Or in general something that has a similar functionality to sample?Conscious
@Ironbark There should be a 1 as the initial value in the returned vectorArbour
@Erik-schutte That is the exact output desiredArbour
I was expecting a very easy solution to this problem that I was over looking but this seems more complicated than I would have thought. Thank you @Ironbark for this solutionArbour
Yet another option with sapply...don't know why it was downvoted but: c(1, unlist(sapply(1:(length(x)-1), function(i) head((x[i]:x[i+1]),-1) )), tail(x,1))Strepphon
I
17

This seems to work, assuming an implicit initial value of 1:

res <- Reduce(function(y, z) c(head(y,-1), tail(y,1):z), x, init=1L)
# 1 2 3 4 5 4 3 2 1 2 3 4 5 6

If you must have it as a comma-ed string: paste(res, collapse=",").


For a large problem, this will become pretty inefficient, since I'm growing an object in a loop. I'd suggest the Rcpp package for that case, or working out the math more carefully.

Ironbark answered 24/4, 2017 at 14:59 Comment(0)
S
3

Another work around using mapply:

c(1, unlist(mapply(function(s,e) tail(s:e,-1), head(c(1,x),-1), x)))
#[1] 1 2 3 4 5 4 3 2 1 2 3 4 5 6

OR

c(seq(x[1]-1), 
  unlist(sapply(seq(length(x)-1), function(i) head(x[i]:x[i+1], -1))), 
  tail(x,1))

#[1] 1 2 3 4 5 4 3 2 1 2 3 4 5 6

Benchmarking (base R solutions)

library(microbenchmark)
set.seed(1)
x <- sample(1000, 500, replace = FALSE)
f_Frank <- function(x) Reduce(function(y, z) c(head(y,-1), tail(y,1):z), x, init=1L)
f_989_1 <- function(x) c(1, unlist(mapply(function(s,e) tail(s:e,-1), head(c(1,x),-1), x)))
f_989_2 <- function(x)
c(seq(x[1]-1), 
  unlist(sapply(seq(length(x)-1), function(i) head(x[i]:x[i+1], -1))), 
  tail(x,1))
f_akrun <- function(x){
    v1 <- rle(unlist(Map(":", x[-length(x)], x[-1])))$values
    c(seq(v1[1]), v1[-1]) 
}

r <- f_Frank(x)
all(r==f_989_1(x))
#[1] TRUE
all(r==f_989_2(x))
#[1] TRUE
all(r==f_akrun(x))
#[1] TRUE

res <- microbenchmark(f_Frank(x), f_989_1(x), f_989_2(x), f_akrun(x))
print(res, order="mean")

# Unit: milliseconds
       # expr        min         lq       mean     median         uq        max neval
 # f_989_1(x)   5.851345   6.113956   6.627022   6.308359   7.256490   9.286613   100
 # f_989_2(x)   5.604960   5.794707   7.260833   5.946143   6.876246  58.284487   100
 # f_akrun(x)   6.826068   7.726124  13.491295   8.263214   8.983740  63.384959   100
 # f_Frank(x) 287.564706 340.390713 351.593511 344.465231 359.258399 454.095461   100
Samovar answered 24/4, 2017 at 15:41 Comment(0)
V
2

We can use an Rcpp implementation. If the file is 'file1.cpp'

#include <Rcpp.h>


//[[Rcpp::export]]

using namespace Rcpp;

// [[Rcpp::export]]
List rleC(NumericVector x) {
  std::vector<int> lengths;
  std::vector<double> values;

  // Initialise first value
  int i = 0;
  double prev = x[0];
  values.push_back(prev);
  lengths.push_back(1);

  NumericVector::iterator it;
  for(it = x.begin() + 1; it != x.end(); ++it) {
    if (prev == *it) {
      lengths[i]++;
    } else {
      values.push_back(*it);
      lengths.push_back(1);

      i++;
      prev = *it;
    }
  }

  return List::create(
    _["lengths"] = lengths, 
    _["values"] = values
  );
}

// [[Rcpp::export]]

Rcpp::NumericVector  newSeq(Rcpp::NumericVector z) {
     int zlen = z.length();
     Rcpp::List zlist(zlen);
     for(int i = 0; i < zlen; i++){
         if(z[i+1] > z[i]) {
         zlist[i] = Rcpp::seq(z[i], z[i+1]);
         } else {
           zlist[i] = Rcpp::rev(Rcpp::seq(z[i+1], z[i]));    

         }
     }

    Rcpp::Environment stats1("package:base");
    Rcpp::Function unlist = stats1["unlist"];

    return rleC(unlist(Rcpp::head(zlist, -1)))["values"];


}

We source the file

library(Rcpp)
sourceCpp("file1.cpp")
c(1, newSeq(x))
#[1] 1 2 3 4 5 4 3 2 1 2 3 4 5 6

Also, using a base R option (earlier deleted answer)

v1 <- rle(unlist(Map(":", x[-length(x)], x[-1])))$values
c(seq(v1[1]), v1[-1]) 
#[1] 1 2 3 4 5 4 3 2 1 2 3 4 5 6
Voccola answered 24/4, 2017 at 21:35 Comment(0)
L
0

Similar to @Mike H.'s comment above, each element is the start or end of a sequence. Using vectorised diff() and lapply improves speed too:

x <- c(2,5,1,6)
xpand <- unlist(lapply(1:(length(x)-1),function(a){x[a]:x[a+1]}))
xpand <- xpand[diff(xpand)!=0] #remove duplicates

If you want the sequence to start from 1, just bind a 1 at the start of x.

edit: benchmark results:

f_max <- function(x){
  x <- c(1,x)
  v1 <- unlist(lapply(1:(length(x)-1),function(a){x[a]:x[a+1]}))
  v1[diff(v1)!=0]
}
       expr      min        lq       mean    median        uq      max neval cld
   f_max(x)   3.1681   3.30260   5.094495   3.49680   5.03835  19.2932   100  a 
 f_989_2(x)   3.6907   3.83715   6.019684   4.14230   5.61495  21.6221   100  a 
 f_989_1(x)   4.2068   4.32475   6.275782   4.60405   6.02450  22.2171   100  a 
 f_akrun(x)   5.0433   5.22070   8.345722   5.48435   8.84605  30.4506   100  a 
 f_Frank(x) 130.6774 141.29090 217.772798 156.17090 181.07895 738.2167   100   b
Luing answered 3/5, 2023 at 12:34 Comment(0)
H
0

This is an interesting question and it would be fun to play approx or approxfun with it

> k <- cumsum(abs(c(x[1], diff(x))))

> c(if (min(k) > 1) seq(min(k) - 1), approxfun(k, x)(min(k):max(k)))
 [1] 1 2 3 4 5 4 3 2 1 2 3 4 5 6

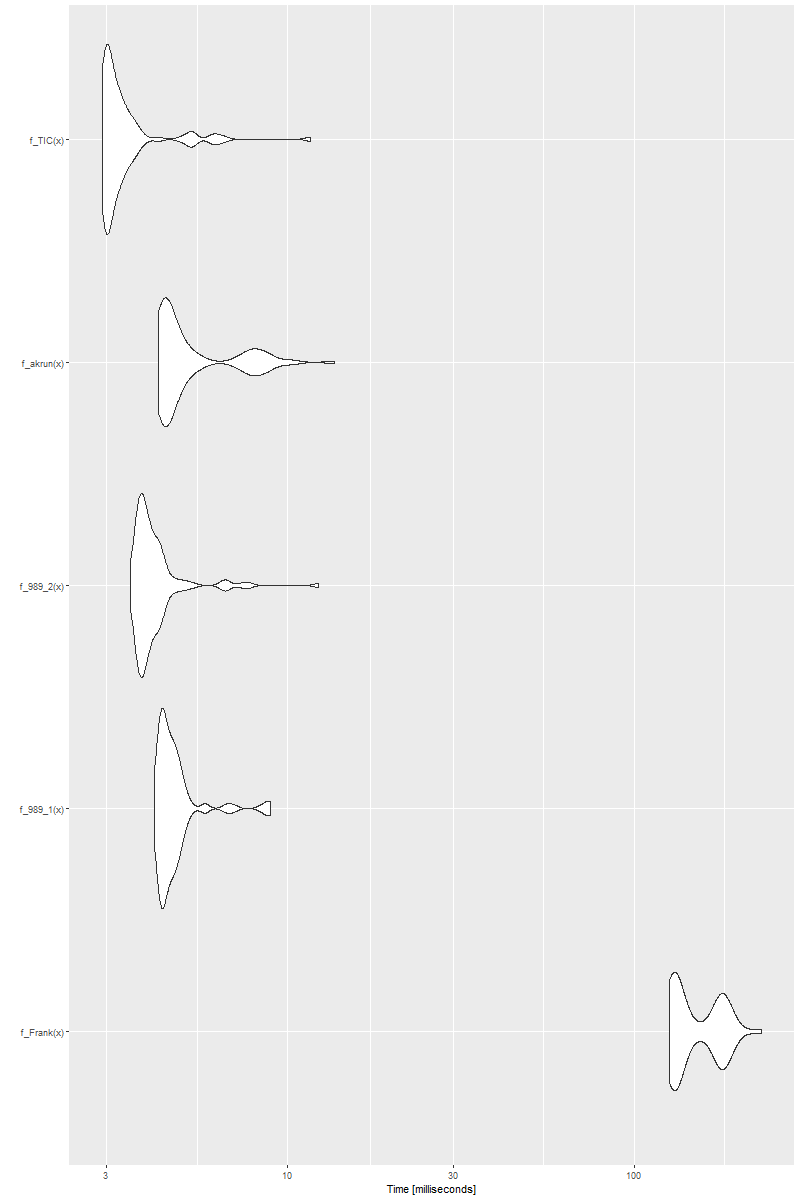
Benchmarking (base R options)

(there are some interesting findings, see the result below)

Just borrow the benchmarking example from 989. Given the presented approaches as below

f_Frank <- function(x) Reduce(function(y, z) c(head(y, -1), tail(y, 1):z), x, init = 1L)
f_989_1 <- function(x) c(1, unlist(mapply(function(s, e) tail(s:e, -1), head(c(1, x), -1), x)))
f_989_2 <- function(x) {
  c(
    seq(x[1] - 1),
    unlist(sapply(seq(length(x) - 1), function(i) head(x[i]:x[i + 1], -1))),
    tail(x, 1)
  )
}
f_akrun <- function(x) {
  v1 <- rle(unlist(Map(":", x[-length(x)], x[-1])))$values
  c(seq(v1[1]), v1[-1])
}

f_TIC <- function(x) {
  k <- cumsum(abs(c(x[1], diff(x))))
  c(if (min(k) > 1) seq(min(k) - 1), approxfun(k, x)(min(k):max(k)))
}

we run a vector x of length 500

set.seed(1)
x <- sample(1000, 500, replace = FALSE)

bm <- microbenchmark(
  f_Frank(x),
  f_989_1(x),
  f_989_2(x),
  f_akrun(x),
  f_TIC(x),
  check = "equal"
)
ggplot2::autoplot(bm)

and we will see enter image description here

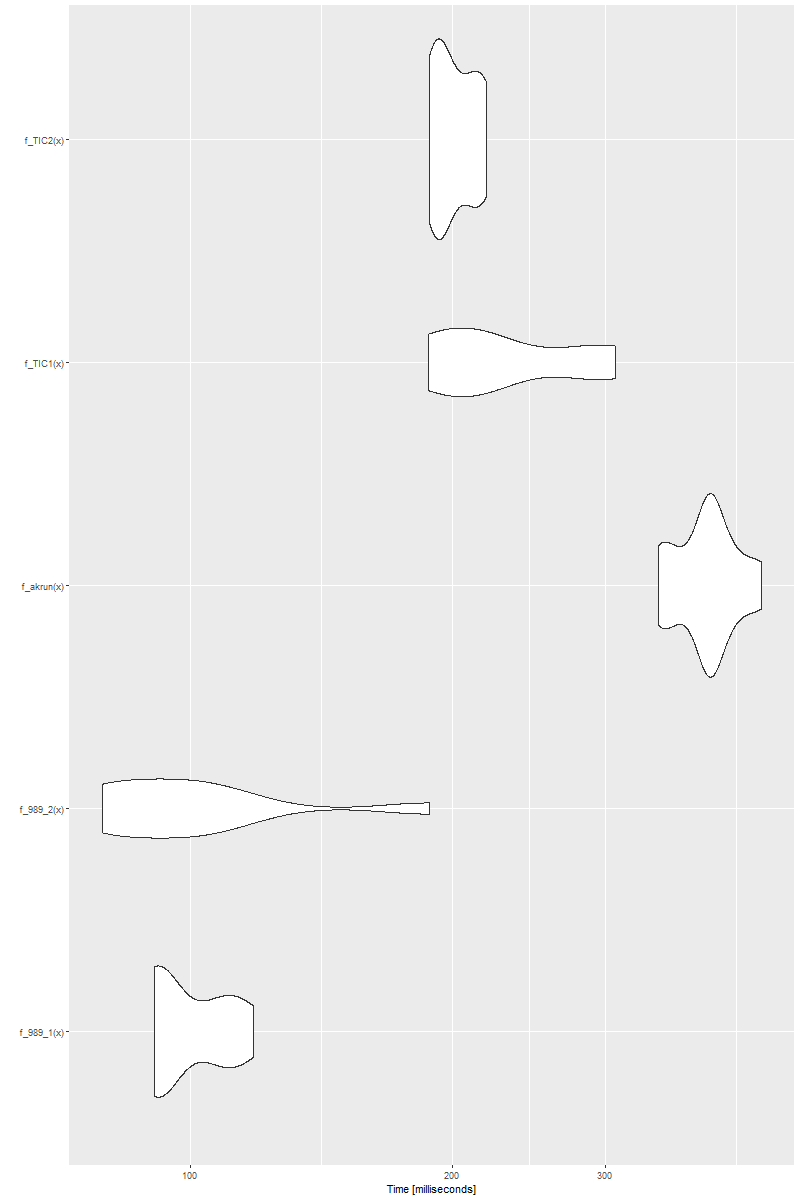
However and interestingly, if we increase the length of x to even longer, say, 5000 for example, i.e., x <- sample(5000, replace = FALSE), we see

enter image description here

Honebein answered 3/5, 2023 at 13:18 Comment(0)

© 2022 - 2024 — McMap. All rights reserved.