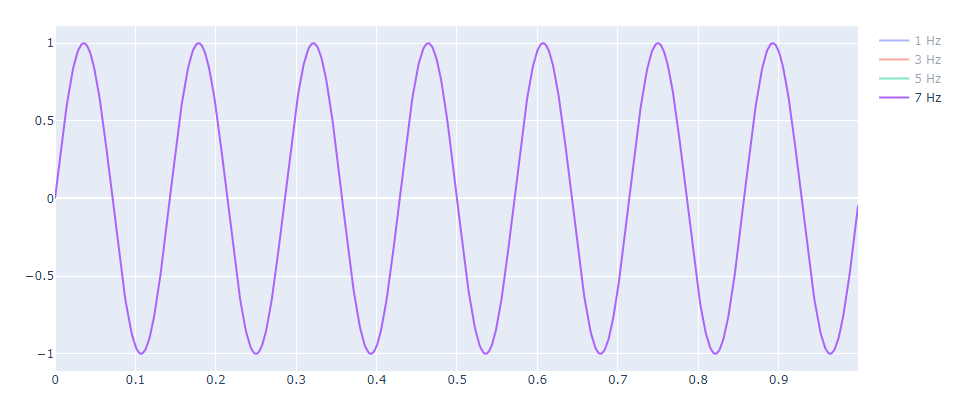
I got a line chart, with multiple lines that represent sine waves with different frequencies.
I want to take a look at a specific wave, with all the rest out of the graph. I know that I can click, in the legend, on the lines I don't want to see and it will make them go away.
I was wondering if there is an interactive way to deselect all lines in one click, instead of clicking each one of them.
My code:
import numpy as np
import plotly.graph_objects as go

step = 1/1000
t = np.arange(0,1,step)    # time vector
trig_func = lambda ff : np.sin(2*np.pi*ff*t)

fig = go.Figure()

for freq in [1, 3, 5, 7]:
    y = trig_func(freq)
    fig.add_trace(go.Scatter(x=t, y=y, name=f"{freq} Hz"))

fig.show()


