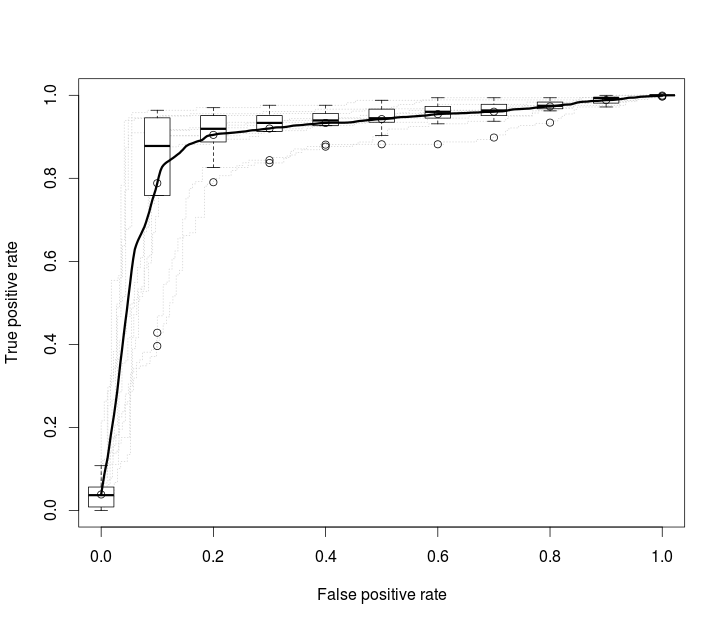
The ROCR library in R offer the ability to plot an average ROC curve (right from the ROCR reference manual):
library(ROCR)
library(ROCR)
data(ROCR.xval)
# plot ROC curves for several cross-validation runs (dotted
# in grey), overlaid by the vertical average curve and boxplots
# showing the vertical spread around the average.
data(ROCR.xval)
pred <- prediction(ROCR.xval$predictions, ROCR.xval$labels)
perf <- performance(pred,"tpr","fpr")
plot(perf,col="grey82",lty=3)
plot(perf,lwd=3,avg="vertical",spread.estimate="boxplot",add=TRUE)
Lovely. Unfortunately, there's seemingly no ability to obtain the average ROC curve itself as an object/dataframe/etc. for further statistical testing (say, with pROC). I did do some research (albeit perhaps after the fact), and I found this post:
I looked through ROCR's code reveals the following lines for passing a result to a plot:
performance_plots.R, (starting at line 451)
## compute average curve
 perf.avg <- perf.sampled
 [email protected] <- list( rowMeans( data.frame( [email protected])))
 [email protected] <- list(rowMeans( data.frame( [email protected])))
 [email protected] <- list( alpha.values )
So, using the trace function I looked up here (General suggestions for debugging in R):
trace(.performance.plot.horizontal.avg, edit=TRUE)
I added the following line to the performance_plots.R after the lines listed above:
perf.rocr.avg <<- perf.avg # note the double `<<`
A horrible hack, yet it works as I can plot perf.rocr.avg without a problem. Unfortunately, when using pROC, I can't compare my averaged ROC curve because it requires a pROC roc object. That's fine, but the catch is that the pROC roc object requires the original prediction and reference data to create. As far as I can tell, ROCR is averaging the ROC curves themselves and not the predictions, so it seems I can't get what I want out of ROCR.
Is there a way to reverse-engineer the predictions from the averaged ROC curve created by ROCR?


perf.avg.rocr <<- perf.avg, which gives me a ROCRperformanceobject, and the desired average ROC plot. Unfortunately, I now realize I can't useroc.testbecause it's not apredictionobject. Any other advice welcomed... – IsidoreROCR. It's just that it doesn't do what I need it to. To make matters worse,pROConly accepts arocobject for statistical testing, which itself requires the original prediction and reference data. I'll keep at it on my end. – Isidore