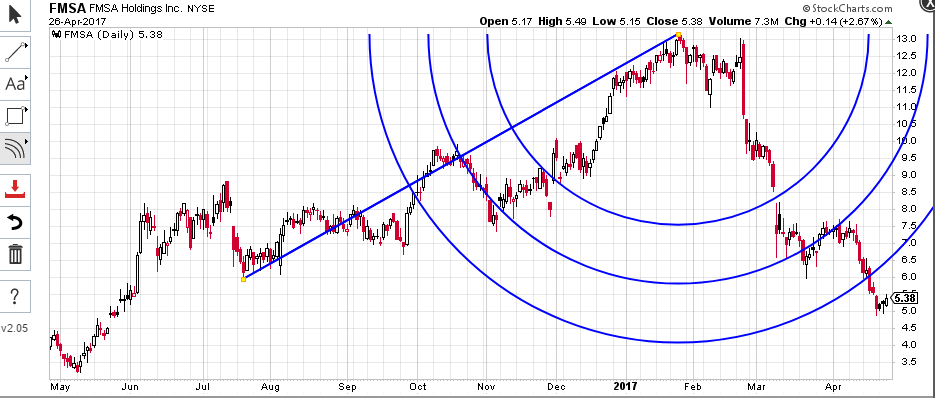
I am attempting to create an application that draws Fibonacci Arcs similar to these.

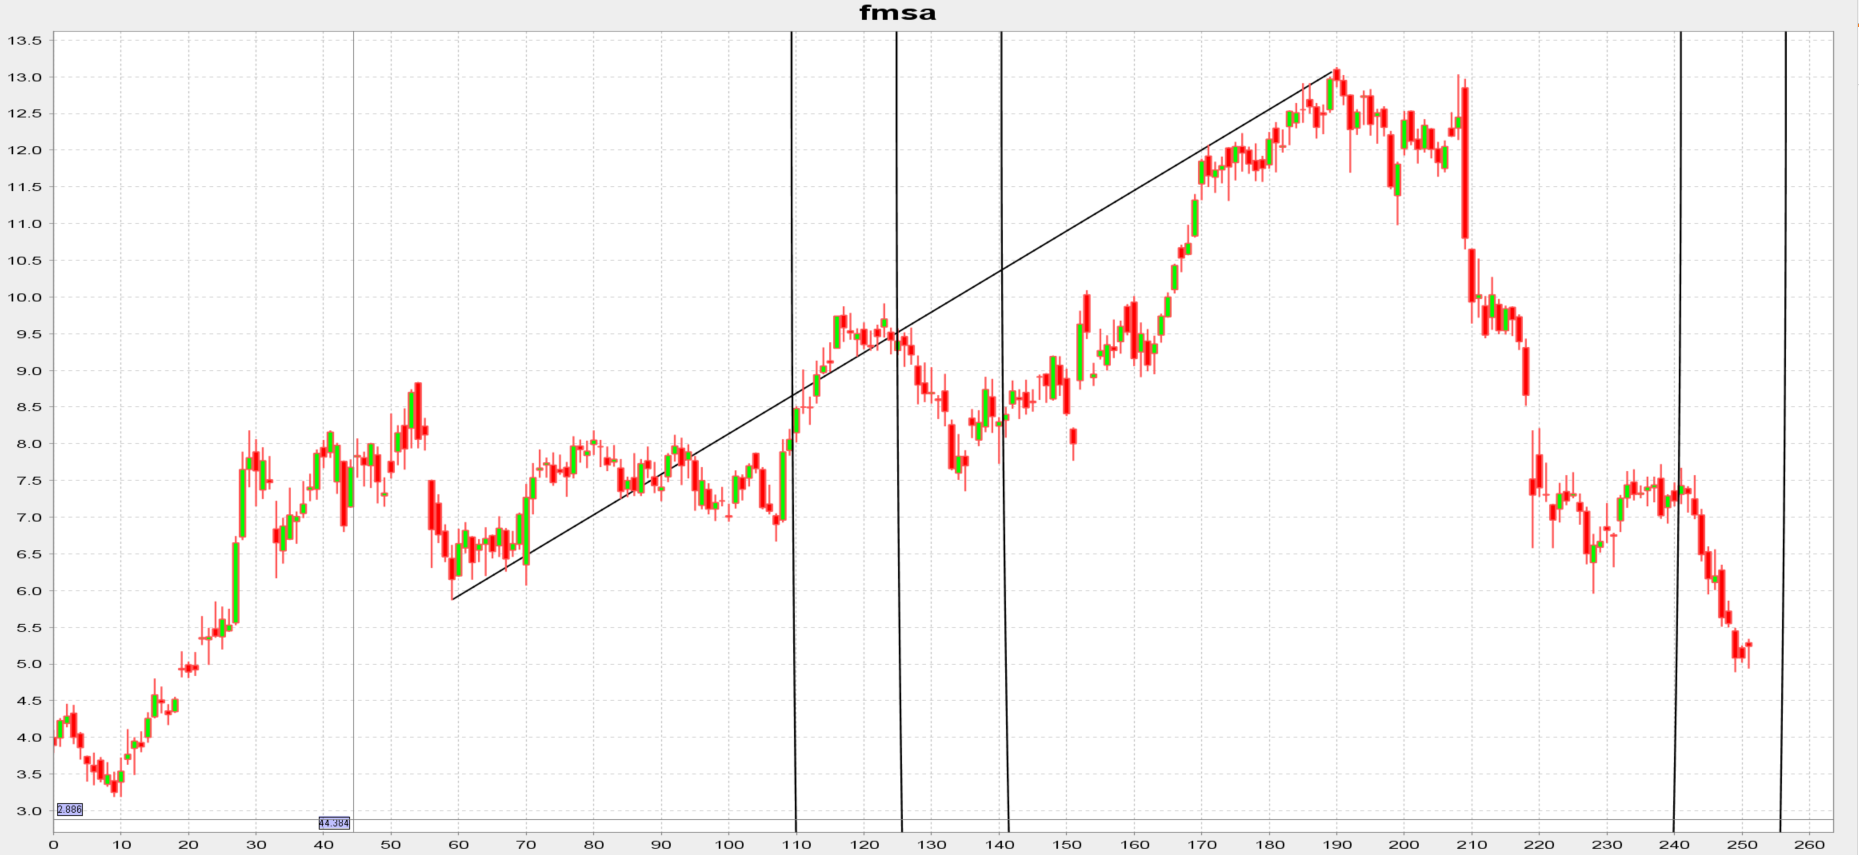
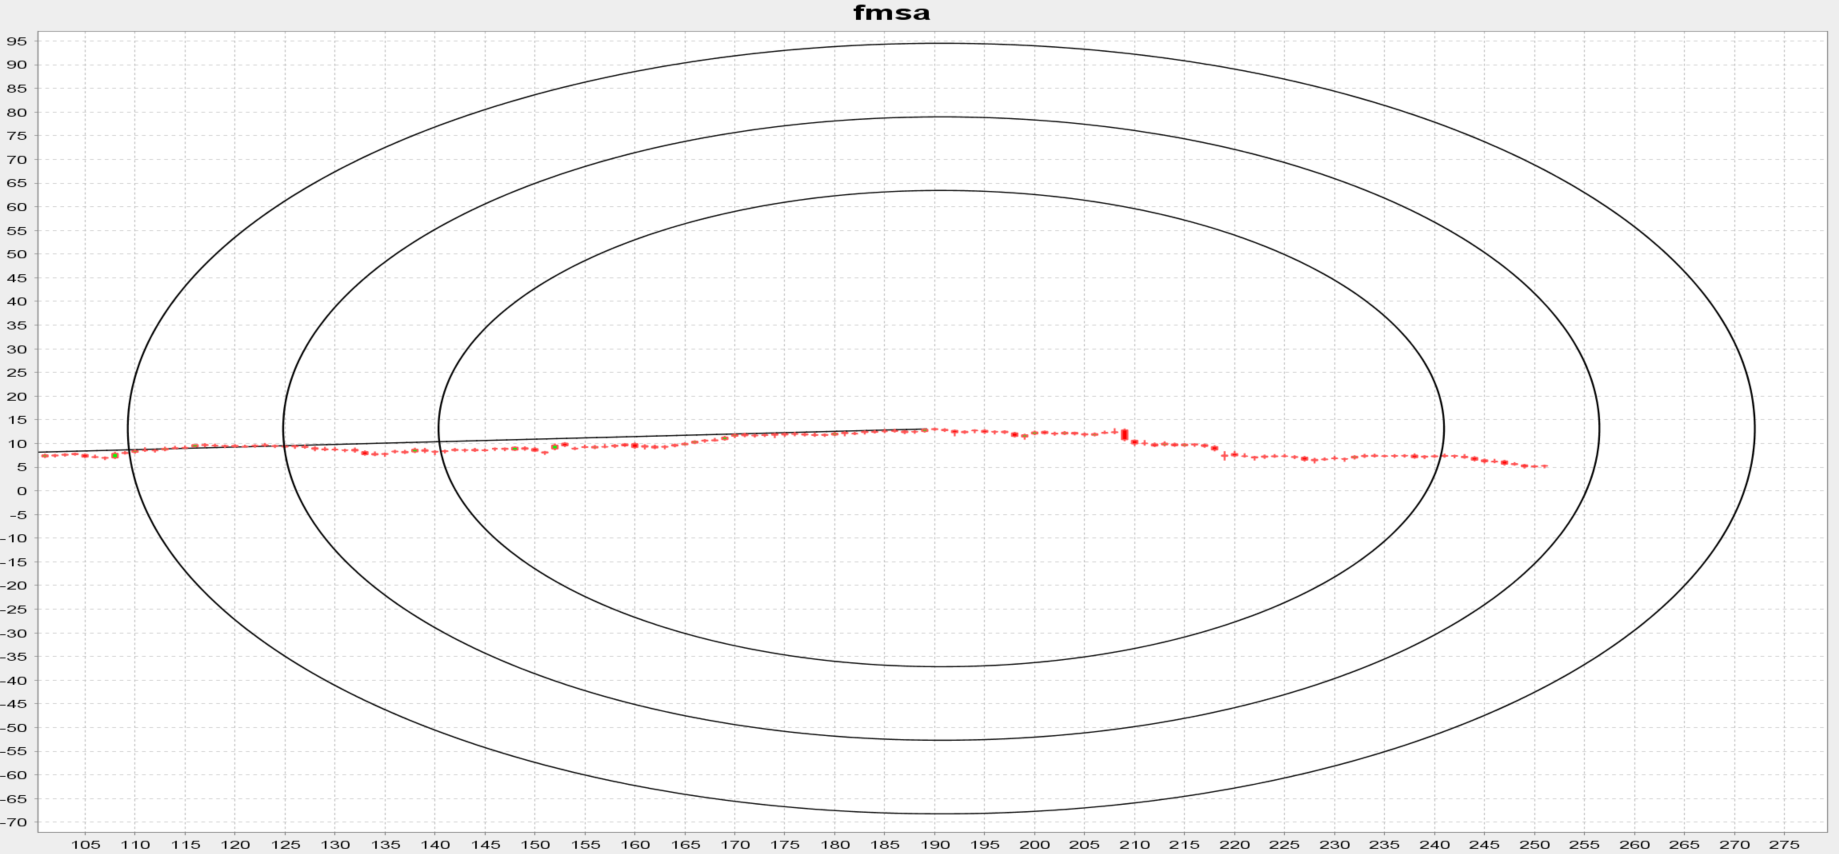
However, I'd like full circles instead of arcs, and I'd like to draw more than the three Fibonacci lines shown in the picture. I've created an application using JFreeChart to attempt to accomplish this. However, here is the result when trying to draw the same arcs (but as circles) shown in the previous picture. 
Initially, it just looks wrong, but when I zoom out, it is indeed a circle, but it's way too big. 
To calculate the arcs, you draw a line, then take a Fibonacci ratio - let's use .381 for example - the percentage of that line. If you look at the first picture, you'll see the innermost arc intersects the line at .381% the distance of the line from the centre of the circle. First I calculate this point. Then I construct a line from the .381% point to the centre. Then I take the distance of this line, which should be the radius. Then I use this radius to draw the circle.
Here's the code to calculate the radius. Where stop and start are the stop and start points of the line drawn.
multiplier = ratio38Value + i;
diffx = (stop.getX() - start.getX()) * multiplier;
diffy = (stop.getY() - start.getY()) * multiplier;
xValue = start.getX() + diffx;
yValue = start.getY() + diffy;
point = new Point(xValue, yValue);
lineSegment = new Line(point, stop);
radius = lineSegment.getDistance();
circle = new Circle(stop.getX(), stop.getY(), radius);
circles.add(circle);
Here is the code to calculate the distance of a line
public double getDistance(){
    double x = Math.pow(endPoint.getX() - startPoint.getX(), 2);
    double y = Math.pow(endPoint.getY() - startPoint.getY(), 2);
    return Math.sqrt(x + y);

}
I get back a list of circle objects (this is an object I created that holds the radius and centre point) one for each circle that needs to be drawn and then draw them.
List<Circle> circles = fibonacciCalculations.getFibonacciArcs(startPoint, endPoint);
if(circles != null)
{
    for (Circle circle : circles){
        double xCenter = circle.getX();
        double yCenter = circle.getY();
        double radius = circle.getRadius();
        plot.addAnnotation(new XYShapeAnnotation(new Ellipse2D.Double(xCenter - radius, yCenter - radius, radius + radius, radius + radius)));
    }
}
I think the issue has something to do with how the x-axis of time and the y axis of price doesn't exactly correlate. What I mean is, if the radius is 20, you'll be going 20 units away from the centre at each point. So say you're stock price is only 5 dollars, at your lowest point you will then be at -15. If that is the case, I have no idea how to fix it. But it also could be some error in my logic. Any ideas would be appreciated.
EDIT: While the bars look like they may be weekly bars in the first picture, they are indeed daily bars. Also, I have already converted the coordinates from data space to x y coordinates. I use this code below to do that.
@Override
public void chartMouseMoved(ChartMouseEvent event) {
    Rectangle2D dataArea = cp.getScreenDataArea();
    JFreeChart chart = event.getChart();
    XYPlot plot = (XYPlot) chart.getPlot();
    ValueAxis xAxis = plot.getDomainAxis();
    ValueAxis yAxis = plot.getRangeAxis();
    double x = xAxis.java2DToValue(event.getTrigger().getX(), dataArea,
            RectangleEdge.BOTTOM);
    double y = yAxis.java2DToValue(event.getTrigger().getY(), dataArea,
            RectangleEdge.LEFT);


XYShapeAnnotationcoordinates are in "data space," for example. – Twelvetone