How to populate a div with hover text in bokeh?
Asked Answered
D

1

7

I am developing a geographical dashboard in bokeh. It is fairly easy to use hover tooltip in bokeh, however I want to populate a div when I hover on a field.

Python version : 3.5.2

Bokeh version : 0.13.0

1. This is the main view of the dashboard.

Dashboard

2. Required output

Required Dashboard

I want to add two interactions,

  1. When I hover on a district, it should only populate the district name field.
  2. When I click on a district, it should populate both the district name and info field(area, population, density).

3. Data:

Data

4. Code:

from bokeh.io import show, output_notebook, output_file
from bokeh.models import (
    GeoJSONDataSource,
    HoverTool,
    LinearColorMapper,
    ColorBar,
    BasicTicker,
    PrintfTickFormatter,
    LogColorMapper,
    Range1d,
    Plot,
    Text
)
from bokeh.plotting import figure
import geopandas as gpd
    with open('/home/drogon/Desktop/Rescue-1122-project/punjab_districts(area_pop_den).geojson', 'r') as f:
        geo_source = GeoJSONDataSource(geojson=f.read())
    
    df = gpd.read_file('/home/drogon/Desktop/Rescue-1122-project/punjab_districts(area_pop_den).geojson')
    print(df.density)
    density = df['density']
    
    colors = ['#000003', '#3B0F6F', '#8C2980', '#DD4968', '#FD9F6C']
    colors.reverse()
    color_mapper = LogColorMapper(palette=colors, low=density.min(), high=density.max())
    
    TOOLS = "pan,wheel_zoom,box_zoom,reset,hover,save"
    
    p = figure(title="Punjab Districts", tools=TOOLS, x_axis_location=None, y_axis_location=None, width=800, height=800)
    p.grid.grid_line_color = None
    p.title.text_font_size = '30pt'
    
    p.patches('xs', 'ys', fill_alpha=0.9, fill_color={'field': 'density', 'transform': color_mapper},
              line_color='white', line_width=1, source=geo_source)
    
    
    hover = p.select_one(HoverTool)
    hover.point_policy = "follow_mouse"
    hover.tooltips = [("District", "@district"),
                      ("Density", "@density"),
                      ("Area", "@area")]
    
    color_bar = ColorBar(color_mapper=color_mapper, major_label_text_font_size="10pt",
                         ticker=BasicTicker(desired_num_ticks=8),
                         formatter=PrintfTickFormatter(format="%d"),
                         label_standoff=10, border_line_color=None, location=(0, 0))
    p.add_layout(color_bar, 'right')
    show(p)
Donato answered 13/9, 2018 at 23:22 Comment(1)
have you figured it out? I am about to do something similar, though your idea to populate a div is interesting. I think that it is my feasible to do it in the def() as a separate scrip/div and add it in the html file.Oxidimetry
S
0

As you did not include it in your question, I did not manage to get the exact same data as you did. Instead I used this json file on Kaggle combined with the information available on Wikipedia

As this is an old question, please note that the version are different than yours:

Python version: 3.8.2

Bokeh version: 3.0.1

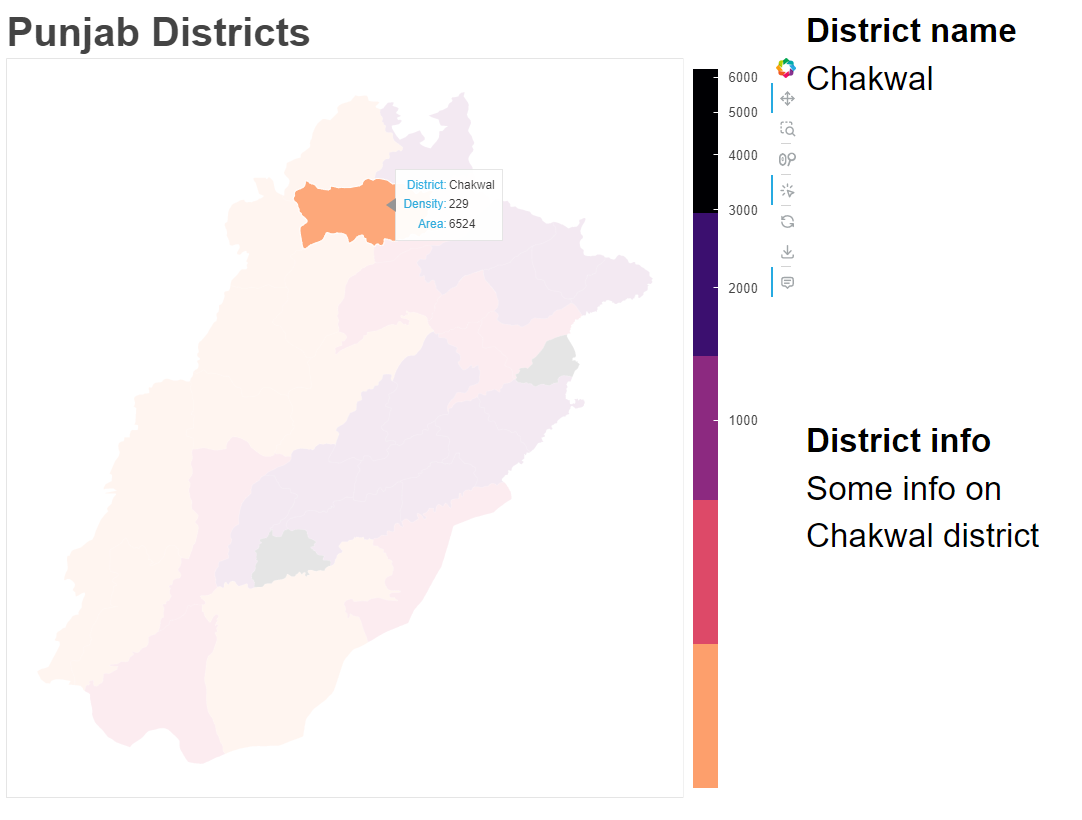
In order to add interaction to your plot, you need to implement JavaScript callbacks that will change the text of Div objects. For more details on the topic, please have a look at Bokeh documentation on JavaScript callbacks

from bokeh.io import show, output_notebook, output_file
from bokeh.models import (
    GeoJSONDataSource,
    HoverTool,
    LinearColorMapper,
    ColorBar,
    BasicTicker,
    PrintfTickFormatter,
    LogColorMapper,
    Range1d,
    Plot,
    Text,
    Div,
    CustomJS,
    TapTool
)
from bokeh.plotting import figure
from bokeh.layouts import column, row
from bokeh import events

import geopandas as gpd

with open('data/punjab_districts_updated.geojson', 'r') as f:
    geo_source = GeoJSONDataSource(geojson=f.read())


df = gpd.read_file('data/punjab_districts_updated.geojson')
density = df['density']
    
colors = ['#000003', '#3B0F6F', '#8C2980', '#DD4968', '#FD9F6C']
colors.reverse()
color_mapper = LogColorMapper(palette=colors, low=density.min(), high=density.max())
    
TOOLS = "pan,wheel_zoom,box_zoom,tap,reset,save"

p = figure(title="Punjab Districts", tools=TOOLS, x_axis_location=None, y_axis_location=None, width=800, height=800)
p.grid.grid_line_color = None
p.title.text_font_size = '30pt'

div_district = Div(width=300, height=400)
div_info = Div(width=300)

# You need a layout to combine your map plot with the text boxes
layout = row(p, column(div_district, div_info))
p.patches('xs', 'ys', fill_alpha=0.9, fill_color={'field': 'density', 'transform': color_mapper},
              line_color='white', line_width=1, source=geo_source)

# This JavaScript code will update the district name at the top right of your plot
code = """
const indices = cb_data.index.indices;
if (indices.length > 0){
    div_text.text = "<span style='float: left; clear: left; font-size: 25pt'><b>District name</b><br>" + district[indices[0]] + "</span>";
}
else {
    div_text.text = "<span style='float: left; clear: left; font-size: 25pt'><b>District name</b><br>  </span>";
}
"""
callback = CustomJS(args={'district': df.district, 'div_text': div_district}, code=code)

# When you add the Hover tool to the plot, you can specify a callback to keep the hover tooltips
p.add_tools(HoverTool(tooltips=[("District", "@district"),
                      ("Density", "@density"),
                      ("Area", "@area")],
                      point_policy= "follow_mouse",
                      callback=callback))

# In this case, we will display pieces of information on the district each time the selection changes in the data source of the plot
callback_tap = CustomJS(args=dict(s=geo_source, district=df.info_district, div_text=div_info), code="""
    const indices = s.selected.indices;
    if (indices.length > 0) {
        div_text.text = "<span style='float: left; clear: left; font-size: 25pt'><b>District info</b><br>" + district[indices[0]] + "</span>";
    }
    else {
        div_text.text = "<span style='float: left; clear: left; font-size: 25pt'><b>District info</b><br></span>";
    }
""")
geo_source.selected.js_on_change('indices', callback_tap)

color_bar = ColorBar(color_mapper=color_mapper, major_label_text_font_size="10pt",
                         ticker=BasicTicker(desired_num_ticks=8),
                         formatter=PrintfTickFormatter(format="%d"),
                         label_standoff=10, border_line_color=None, location=(0, 0))
p.add_layout(color_bar, 'right')
show(layout)

The result is the following when you select a district: Example_image

Seaden answered 7/3, 2023 at 15:57 Comment(0)

© 2022 - 2024 — McMap. All rights reserved.