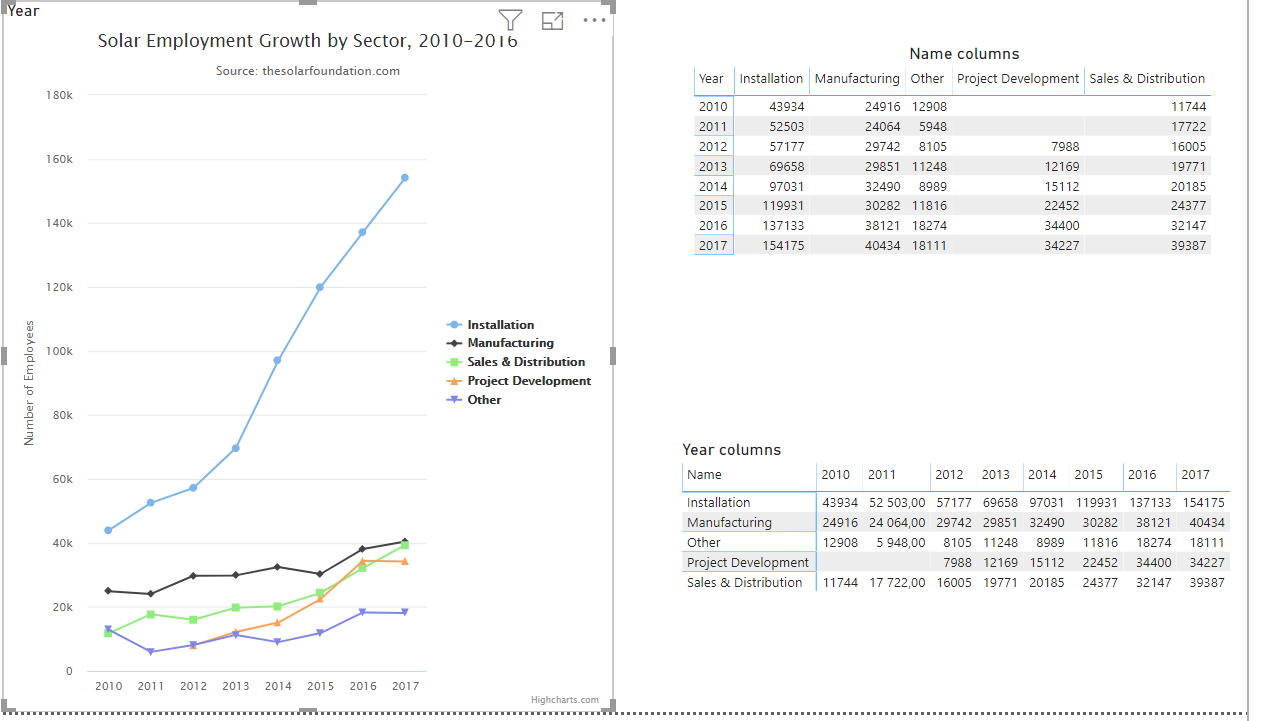
Bharath R created a nice example of how to create a highcharts custom visual for PowerBI. However, no data binding has been applied yet. For the highcharts line diagram below I would like to use variables instead of hard coded values. So that it is possible to apply data binding.
Here you can find the example PowerBI file that contains the highcharts custom visual and the data that needs to be loaded into the custom visual. In this file I made two data tables. I don't have a preference for one of the two data tables. The important thing is that the data is structured in such a way that it is easiest to load in the highcharts visual.
Example code (visual.ts)
"use strict";

import "core-js/stable";
import "./../style/visual.less";
import powerbi from "powerbi-visuals-api";
import VisualConstructorOptions = powerbi.extensibility.visual.VisualConstructorOptions;
import VisualUpdateOptions = powerbi.extensibility.visual.VisualUpdateOptions;
import IVisual = powerbi.extensibility.visual.IVisual;
import EnumerateVisualObjectInstancesOptions = powerbi.EnumerateVisualObjectInstancesOptions;
import VisualObjectInstance = powerbi.VisualObjectInstance;
import DataView = powerbi.DataView;
import VisualObjectInstanceEnumerationObject = powerbi.VisualObjectInstanceEnumerationObject;

import * as Highcharts from 'highcharts';
import * as Exporting from 'highcharts/modules/exporting';

import { VisualSettings } from "./settings";
export class Visual implements IVisual {
private target: HTMLElement;
private settings: VisualSettings;

    constructor(options: VisualConstructorOptions) {
        console.log('Visual constructor', options);
        this.target = options.element;
    }

    public update(options: VisualUpdateOptions) {
        this.settings = Visual.parseSettings(options && options.dataViews && options.dataViews[0]);
        console.log('Visual update', options);
        var optionMain=this.target;

        /**
         * Code to add highcharts
         */

        Highcharts.chart(optionMain.id, {

            title: {
                text: 'Solar Employment Growth by Sector, 2010-2016'
            },

            subtitle: {
                text: 'Source: thesolarfoundation.com'
            },

            xAxis: {
                categories: ['2010', '2011', '2012', '2013', '2014', '2015', '2016', '2017']
            },

            yAxis: {
                title: {
                    text: 'Number of Employees'
                }
            },
            legend: {
                layout: 'vertical',
                align: 'right',
                verticalAlign: 'middle'
            },

            plotOptions: {
                series: {
                    label: {
                        connectorAllowed: false
                    }
                }
            },

            series: [{
                name: 'Installation',
                data: [43934, 52503, 57177, 69658, 97031, 119931, 137133, 154175],
                type: undefined
            }, {
                name: 'Manufacturing',
                data: [24916, 24064, 29742, 29851, 32490, 30282, 38121, 40434],
                type: undefined
            }, {
                name: 'Sales & Distribution',
                data: [11744, 17722, 16005, 19771, 20185, 24377, 32147, 39387],
                type: undefined
            }, {
                name: 'Project Development',
                data: [null, null, 7988, 12169, 15112, 22452, 34400, 34227],
                type: undefined
            }, {
                name: 'Other',
                data: [12908, 5948, 8105, 11248, 8989, 11816, 18274, 18111],
                type: undefined
            }],

            responsive: {
                rules: [{
                    condition: {
                        maxWidth: 500
                    },
                    chartOptions: {
                        legend: {
                            layout: 'horizontal',
                            align: 'center',
                            verticalAlign: 'bottom'
                        }
                    }
                }]
            }

        });


    }

    private static parseSettings(dataView: DataView): VisualSettings {
        return VisualSettings.parse(dataView) as VisualSettings;
    }

    /**
     * This function gets called for each of the objects defined in the capabilities files and allows you to select which of the
     * objects and properties you want to expose to the users in the property pane.
     *
     */
    public enumerateObjectInstances(options: EnumerateVisualObjectInstancesOptions): VisualObjectInstance[] | VisualObjectInstanceEnumerationObject {
        return VisualSettings.enumerateObjectInstances(this.settings || VisualSettings.getDefault(), options);
    }
}

