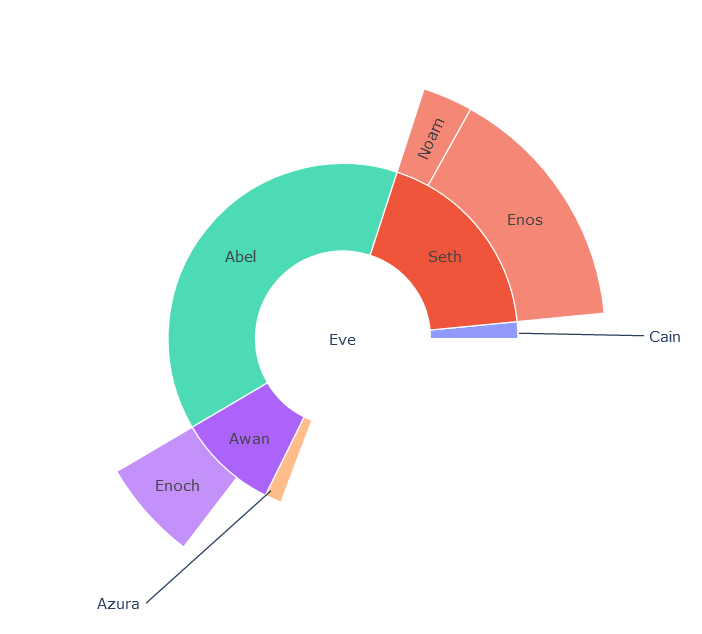
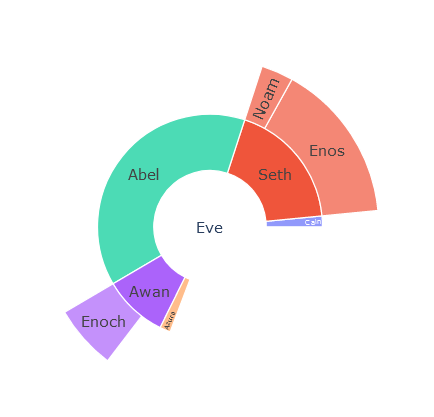
I'm trying to draw a sunburst chart, but some items are too small to be visible.
ex : this code...
fig =go.Figure(go.Sunburst(
    labels=[ "Eve", "Cain", "Seth", "Enos", "Noam", "Abel", "Awan", "Enoch", "Azura"],
    parents=["",    "Eve",  "Eve",  "Seth", "Seth", "Eve",  "Eve",  "Awan",  "Eve" ],
    values=[  65,    1,     12,     10,     2,      25,      6,      4,       1],
    branchvalues="total",
    sort = False
))
...gives me :
I can hide small items like this :
fig.update_layout(
    title_text=f"biblical family",
    uniformtext=dict(minsize=8, mode='hide'),
    width=900, height=700
)
But I would prefer show them more like that :

Here, I used fig.add_annotation
fig.add_annotation(
    text=f'Azura',
    xanchor='right',
    x=0.41, y=0.21,
    ax=-100, ay=90)
But, is there a way to show external items that are to small to be printed outside of the chart ? Without doing it by hand :p
Or at least, catch the position of the center of each slice, so I could use fig.add_annotation automatically ? :D
Thank you very much :D

