16-QAM modulation and demodulation - missing one line in the graph
Asked Answered
C

2

7

I am trying to do modulation and demodulation for 16-QAM and then trying to compare theoretical and simulated BER.

I am not getting simulation-line in the graph. Missing the <simulation>-line

I can not understand what is wrong with my code. Can anybody help me?

here is the code:

M=16;
SNR_db = [0 2 4 6 8 10 12];
x = randi([0,M-1],1000,1);
hmod = modem.qammod(16);
hdemod = modem.qamdemod(hmod,'SymbolOrder', 'Gray');
tx = zeros(1,1000);
for n=1:1000
    tx(n) = modulate(hmod, x(n));
end
rx = zeros(1,1000);
rx_demod = zeros(1,1000);
for j = 1:7
    err = zeros(1,7);
    err_t = zeros(1,7);
    for n = 1:1000
        rx(n) = awgn(tx(n), SNR_db(j));
        rx_demod(n) = demodulate(hdemod, rx(n));

        if(rx_demod(n)~=x(n))
            err(j) = err(j)+1;
        end
    end
    % err_t = err_t + err;
end
theoryBer = 3/2*erfc(sqrt(0.1*(10.^(SNR_db/10))));
figure
semilogy(SNR_db,theoryBer,'-',SNR_db, err, '^-');
grid on
legend('theory', 'simulation');
xlabel('Es/No, dB')
ylabel('Symbol Error Rate')
title('Symbol error probability curve for 16-QAM modulation') 
Cephalo answered 28/4, 2013 at 23:35 Comment(4)
Sorry, can you be more specific with your problem? I can execute your code and there is a figure there. I cant see any problem actually!Selena
I can see this: img401.imageshack.us/img401/5017/so1w.pngSelena
You are overwriting the error count "err" in each iteration of the loop. Even if you fix that it's not quite right, since err is a count where the demodulated signal doesn't match the transmitted one, while the theoretical curve is in terms of probability.Nagano
The other error you have is that you specify gray coding for the demodulator but not for the modulator.Nagano
N
1

http://www.dsplog.com/db-install/wp-content/uploads/2008/06/script_16qam_gray_mapping_bit_error_rate.m

That does what you want manually, without assuming any toolbox functionality (i.e. the fancy modulator and demodulators).

Also you can try

edit commdoc_mod

Make a copy of that file and you should be able to get it to do what you want with one simple loop.

Edit

Here are the modifications to that file that give you the simulated EbNo curves instead of the symbol error rate ones. Should be good enough for any practical purpose.

M = 16;                     % Size of signal constellation
k = log2(M);                % Number of bits per symbol
n = 3e4;                    % Number of bits to process
nSyms = n/k;                % Number of symbols

hMod = modem.qammod(M);         % Create a 16-QAM modulator
hMod.InputType = 'Bit';         % Accept bits as inputs
hMod.SymbolOrder = 'Gray';         % Accept bits as inputs
hDemod = modem.qamdemod(hMod);  % Create a 16-QAM based on the modulator

x = randi([0 1],n,1); % Random binary data stream
tx = modulate(hMod,x);

EbNo = 0:10; % In dB
SNR = EbNo + 10*log10(k);

rx = zeros(nSyms,length(SNR));
bit_error_rate = zeros(length(SNR),1);
for i=1:length(SNR)
    rx(:,i) = awgn(tx,SNR(i),'measured');
end
rx_demod = demodulate(hDemod,rx);
for i=1:length(SNR)
    [~,bit_error_rate(i)] = biterr(x,rx_demod(:,i));
end

theoryBer = 3/(2*k)*erfc(sqrt(0.1*k*(10.^(EbNo/10))));
figure;
semilogy(EbNo,theoryBer,'-',EbNo, bit_error_rate, '^-');
grid on;
legend('theory', 'simulation');
xlabel('Eb/No, dB');
ylabel('Bit Error Rate');
title('Bit error probability curve for 16-QAM modulation');
Nagano answered 29/4, 2013 at 21:28 Comment(0)
R
0

In your code, you confuse Symbol Error Probability and Bit Error Probability. Moreover err = zeros(1,7); is misplaced.

After the corrections:

M=16;
SNR_db = 0:2:12;
N=1000;
x = randi([0,M-1],N,1);
k = log2(M); % bits per symbol

tx = qammod(x, M,'Gray');
err = zeros(1,7);
for j = 1:numel(SNR_db)
    rx = awgn(tx, SNR_db(j),'measured');
    rx_demod = qamdemod( rx, M, 'Gray' );
    [~,err(j)] = biterr(x,rx_demod);
end

theorySER = 3/2*erfc(sqrt(0.1*(10.^(SNR_db/10))));

figure
semilogy(SNR_db,theorySER,'-',SNR_db, err*k, '^-');
grid on
legend('theory', 'simulation');
xlabel('Es/No, dB')
ylabel('Symbol Error Rate')
title('Symbol Error Probability curve for 16-QAM modulation')
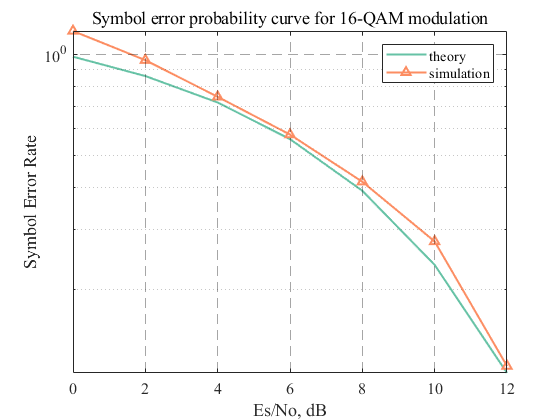
And the resulting graph is: enter image description here

Respondent answered 10/11, 2017 at 15:30 Comment(0)

© 2022 - 2024 — McMap. All rights reserved.