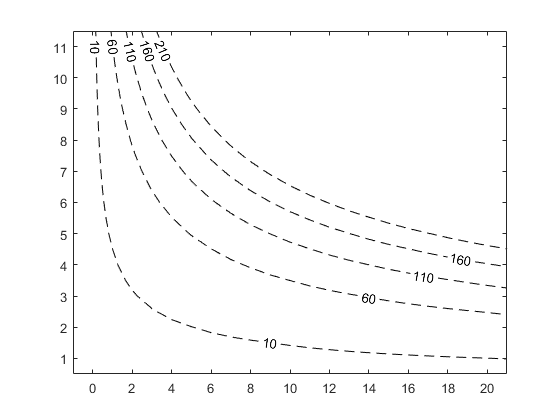
Is there a way to specify the position of the labels on lines of a contour plot - rather than the default or using 'manual' (I have many plots and doing each manually won't help)? I'd like the label to be at the beginning of the contour line (i.e. at the top of the plot, max x position). I am using 'LabelSpacing' in 'clabel' to reduce the number of labels but can you specify where the first one starts? This because I want to overlay it on a pcolor and don't want the labels interfering. See below (where Hlim and Tlim are 1x23 vectors)
%% isolines
figure;
rho=1025; g=9.81; rg64=(rho*g^2)/(64*pi);
Ht=Hlim';
Piso=(rg64.*(Ht.^2)*Tlim)./1000;
v=[10:50:250];
[C,h]=contour(Tlim,Ht,Piso,v,'--','LineColor', 'k');
th=clabel(C,h,'LabelSpacing',300);
strs=get(th,'String');
strs=strcat(strs,' kW/m');
set(th,{'String'},strs,'BackgroundColor','w');

