How to see Chrome's response to Websocket's ping frame
Asked Answered
S

1

7

I do not have a choice of installing a network traffic analyzer.

How would I go about looking at the response from chrome to a websocket's ping frame.

In chrome dev tools, it seems we can only see the incoming frames.

Background: I am trying to develop a websocket java client, but the server sends a close soon after a ping, I am assuming this is because of lack of response from the client. I have tried responding with a "pong" and 0xA byte, but still the connection is closed.

Stolen answered 9/7, 2015 at 23:3 Comment(0)
A
1

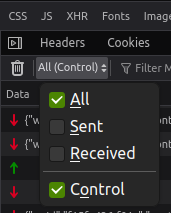
As of 2024, Chrome has added logging of outbound frames, but does not appear to have an option to show control frames (ping/pong). Safari does show them, and Firefox's Chrome-like browser console has an "All" dropdown in in the "Response" pane, which shows an additional "Control" option that must be checked to show the empty ping and pong frames:

screenshot of Firefox WebSocket frame dropdown

So that seems like a logical place for Chrome to do the same thing. I also searched through dozens of settings in the Chrome developer console Preferences and Experiments and did not find any that mentioned WebSockets. There might still be something that can be affected by an advanced setting or file somewhere, but not much has changed in 9 years.

Antependium answered 4/10 at 22:52 Comment(0)

© 2022 - 2024 — McMap. All rights reserved.