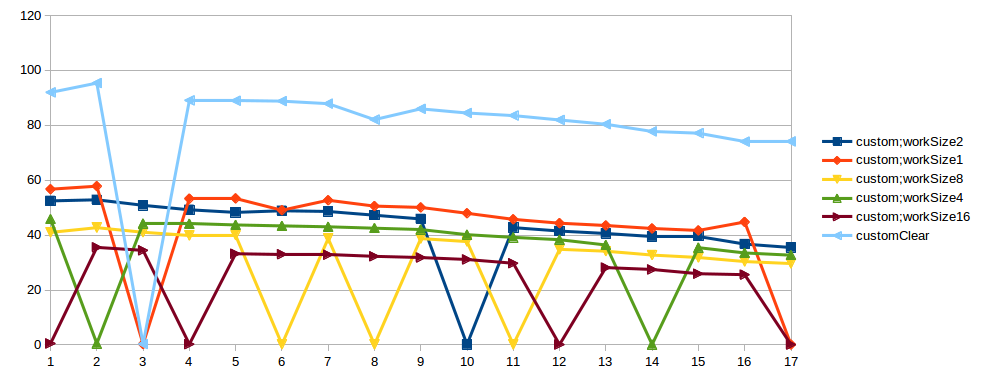
I do investigation about best performance of multithreading increment. I checked implementation based on synchronize, AtomicInteger and custom implementation like in AtomicInteger, but with parkNanos(1), on failed CAS.
private int customAtomic() {
        int ret;
        for (;;) {
            ret = intValue;
            if (unsafe.compareAndSwapInt(this, offsetIntValue, ret, ++ret)) {
                break;
            }
            LockSupport.parkNanos(1);
        }
        return ret;
    }
I made benchmark based on JMH: clear execution each method, each method with consume CPU (1,2,4,8,16 times) and only consume CPU. Each benchmark method performed on Intel(R) Xeon(R) CPU E5-1680 v2 @ 3.00GHz, 8 Core + 8 HT 64Gb RAM, on 1-17 threads. The results surprised me:
- CAS most effective in 1 thread. 2 thread - similar result with monitor. 3 and more - worse than monitor, ~ 2 times.
- The custom implementation in most cases is in 2-3 times better, than monitor.
- But in the custom implementation, randomly sometimes happens bad execution. Good case - 50 op/microsec., bad case - 0.5 op/microsec.
Questions:
- Why AtomicInteger is not based on synchronize, it is more productive, then current impl?
- Why AtomicInteger does not use LockSupport.parkNanos(1), on CAS fail?
- Why does happens this spikes in custom implementation?
I tried to perform this test few times, and spike always happens in different number threads. Also I tried this test in another machines, the result is the same. Maybe it's a problems in test. In "bad case" of custom impl in StackProfiler, I see:
....[Thread state distributions]....................................................................
 50.0%         RUNNABLE
 49.9%         TIMED_WAITING

....[Thread state: RUNNABLE]........................................................................
 43.3%  86.6% sun.misc.Unsafe.park
  5.8%  11.6% com.jad.generated.IncrementBench_incrementCustomAtomicWithWork_jmhTest.incrementCustomAtomicWithWork_thrpt_jmhStub
  0.8%   1.7% org.openjdk.jmh.infra.Blackhole.consumeCPU
  0.1%   0.1% com.jad.IncrementBench$Worker.work
  0.0%   0.0% java.lang.Thread.currentThread
  0.0%   0.0% com.jad.generated.IncrementBench_incrementCustomAtomicWithWork_jmhTest._jmh_tryInit_f_benchmarkparams1_0
  0.0%   0.0% org.openjdk.jmh.infra.generated.BenchmarkParams_jmhType_B1.<init>

....[Thread state: TIMED_WAITING]...................................................................
 49.9% 100.0% sun.misc.Unsafe.park
In "good case":
....[Thread state distributions]....................................................................
 88.2%         TIMED_WAITING
 11.8%         RUNNABLE

....[Thread state: TIMED_WAITING]...................................................................
 88.2% 100.0% sun.misc.Unsafe.park

....[Thread state: RUNNABLE]........................................................................
  5.6%  47.9% sun.misc.Unsafe.park
  3.1%  26.3% org.openjdk.jmh.infra.Blackhole.consumeCPU
  2.4%  20.3% com.jad.generated.IncrementBench_incrementCustomAtomicWithWork_jmhTest.incrementCustomAtomicWithWork_thrpt_jmhStub
  0.6%   5.5% com.jad.IncrementBench$Worker.work
  0.0%   0.0% com.jad.generated.IncrementBench_incrementCustomAtomicWithWork_jmhTest.incrementCustomAtomicWithWork_Throughput
  0.0%   0.0% java.lang.Thread.currentThread
  0.0%   0.0% org.openjdk.jmh.infra.generated.BenchmarkParams_jmhType_B1.<init>
  0.0%   0.0% sun.misc.Unsafe.putObject
  0.0%   0.0% org.openjdk.jmh.runner.InfraControlL2.announceWarmdownReady
  0.0%   0.0% sun.misc.Unsafe.compareAndSwapInt
Link to result graphs. X - threads count, Y - thpt, op/microsec
UPD
Okay, I know, I understand that, when I use parkNanos, one thread also can hold the lock (CAS) for long periods of time. Threads, with CAS-fail, goes sleep, and only one thread doing work and incrementing value. I see, that for big concurrency level, when work is so small - AtomicInteger is not better approach. But if we increase workSize, for example to level = CASThrpt/threadNum, it should works fine: For local machine I have set workSize=300, result of my test:
Benchmark                                     (workSize)   Mode  Cnt  Score   Error   Units
IncrementBench.incrementAtomicWithWork               300  thrpt    3  4.133 ± 0.516  ops/us
IncrementBench.incrementCustomAtomicWithWork         300  thrpt    3  1.883 ± 0.234  ops/us
IncrementBench.lockIntWithWork                       300  thrpt    3  3.831 ± 0.501  ops/us
IncrementBench.onlyWithWork                          300  thrpt    3  4.339 ± 0.243  ops/us
AtomicInteger - win, lock - second place, custom - third. But problem with spikes, still not clear. And I forgot about java version: Java(TM) SE Runtime Environment (build 1.7.0_79-b15) Java HotSpot(TM) 64-Bit Server VM (build 24.79-b02, mixed mode)


But problem with spikes, still not clearDid you check your log file? There are a lot of<failure: VM prematurely exited before JMH had finished with it, explicit System.exit was called?>events – PlumbingincrementCustomAtomicWithWorkwith 3 threads and workSize = 1 failed due tofailure: VM prematurely exitedand has result 0.301 ops/us. It is ok? – PlumbingYou will not have result, when VM prematurely exited.it is opposite of true in case of issue in JMH. WhyincrementCustomAtomicWithWorkfailed in your logs? – Plumbing