I am new to working with pymc3 and I am having trouble generating an easy-to-read traceplot. I'm fitting a mixture of 4 multivariate gaussians to some (x, y) points in a dataset. The model runs fine. My question is with regard to manipulating the pm.traceplot() command to make the output more user-friendly. Here's my code:
import matplotlib.pyplot as plt
import numpy as np
model = pm.Model()
N_CLUSTERS = 4
with model:
    #cluster prior
    w = pm.Dirichlet('w', np.ones(N_CLUSTERS))
    #latent cluster of each observation
    category = pm.Categorical('category', p=w, shape=len(points))

    #make sure each cluster has some values:
    w_min_potential = pm.Potential('w_min_potential', tt.switch(tt.min(w) < 0.1, -np.inf, 0))
    #multivariate normal means
    mu = pm.MvNormal('mu', [0,0], cov=[[1,0],[0,1]], shape = (N_CLUSTERS,2) )
    #break symmetry
    pm.Potential('order_mu_potential', tt.switch(
                                                tt.all(
                                                   [mu[i, 0] < mu[i+1, 0] for i in range(N_CLUSTERS - 1)]), -np.inf, 0))
    #multivariate centers
    data = pm.MvNormal('data', mu =mu[category], cov=[[1,0],[0,1]],  observed=points)

 with model:
     trace = pm.sample(1000)
A call to pm.traceplot(trace, ['w', 'mu']) produces this image:

As you can see, it is ambiguous which mean peak corresponds to an x or y value, and which ones are paired together. I have managed a workaround as follows:
from cycler import cycler
#plot the x-means and y-means of our data!
fig, (ax0, ax1) = plt.subplots(nrows=2)
plt.xlabel('$\mu$')
plt.ylabel('frequency')
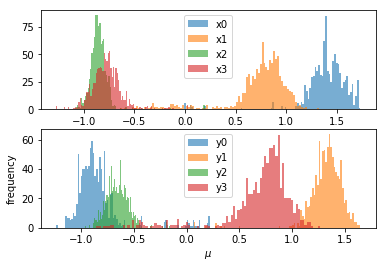
for i in range(4):
    ax0.hist(trace['mu'][:,i,0], bins=100, label='x{}'.format(i), alpha=0.6);
    ax1.hist(trace['mu'][:,i,1],bins=100, label='y{}'.format(i), alpha=0.6);
ax0.set_prop_cycle(cycler('color', ['c', 'm', 'y', 'k']))
ax1.set_prop_cycle(cycler('color', ['c', 'm', 'y', 'k']))
ax0.legend()
ax1.legend()
This produces the following, much more legible plot:

I have looked through the pymc3 documentation and recent questions here, but to no avail. My question is this: is it possible to do what I have done here with matplotlib via builtin methods in pymc3, and if so, how?

compact=False– Vegetative