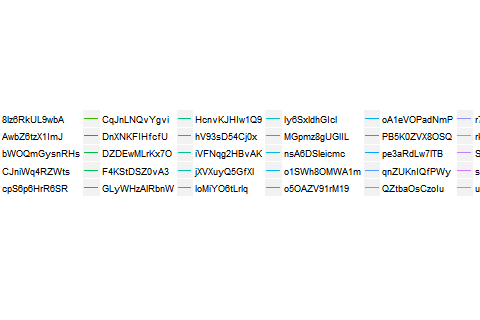
I have some ggplot functionality, but I want to give users a warning in case they abuse it heavily. The problem is this: if there are many groups and the group names are long, the legend becomes so big it takes up the entire plot:
But if I were to change the plot names I would get:
What I have is:
- ggplot / ggbuild object
- dimensions of plot window (480 x 320 default) but can be changed.
I want to use these to estimate the total area taken up by the legend (so I can send out a warning if the ratio legend size / plot size is too big). Here is some example code I used to create the figures:
library(ggplot2)

# stolen from https://ryouready.wordpress.com/2008/12/18/generate-random-string-name/
MHmakeRandomString <- function(n=1, lenght=12) {
    randomString <- c(1:n)
    for (i in 1:n)
    {
        randomString[i] <- paste(sample(c(0:9, letters, LETTERS),
                                        lenght, replace=TRUE),
                                 collapse="")
    }
    return(randomString)
}

makeData <- function(k, useLongNames = FALSE) {

    x <- c(1, 100)
    X <- cbind(1, x)
    b <- matrix(rnorm(2*k), k, 2)

    y <- numeric(2*k)
    for (i in seq_len(k))
        y[1:2 + 2*(i-1)] <- X %*% b[i, ]

    df <- data.frame(x = c(1, n), y = y)

    if (useLongNames) {
        df$g <- factor(rep(MHmakeRandomString(k), each = 2))
    } else {
        df$g <- factor(rep(1:k, each = 2))
    }

    return(df)

}

# okayish plot
df <- makeData(50)
g0 <- ggplot(data = df, aes(x = x, y = y, group = g, color = g)) +
    geom_line() +
    guides(color=guide_legend(nrow=5))

# unreadable plot
df <- makeData(50, useLongNames = TRUE)
g1 <- ggplot(data = df, aes(x = x, y = y, group = g, color = g)) +
    geom_line() +
    guides(color=guide_legend(nrow=5))

# to plot
# x11(width = 480, height = 320)
# print(g0)
# x11(width = 480, height = 320)
# print(g1)
I have the idea that the answer is somewhere in ggplotGrob(). However, I'm unfamiliar with grobs (and could not find clear documentation) and stranded at
gGrob0 <- ggplotGrob(g0)
gGrob1 <- ggplotGrob(g1)
gGrob0$grobs[[15]]$grobs[[1]]$grobs # all legend elements

convertWidth(grobWidth(gGrob0$grobs[[15]]), unitTo = "inches") # 4.5128 inches
convertWidth(grobWidth(gGrob1$grobs[[15]]), unitTo = "inches") # 12.419 inches
# but this is not correct:
# number of legend columns x legend width <= plot width
# 10 * 12.419 <= 480
which seems to give me a lot of information about the stuff I'm interested in. How do I convert this information into the total width the legend will take up? Many thanks in advance.


convertWidth), first, you are "measuring" legends before even specifying the window size, and second, if you copy the plot as a bitmap, paste it to e.g. paint.net and use the "rectangle select" the size of g0 legend is 4.52" x 1.34" and for g1 it is 12.64" x 1.29", so the grob widths are not that off. The size of the whole plot is 14.34" x 9.56" for me. Grobs seem to be the right direction, you just need to find the one representing the plot itself (I guess 3, 6 or 7). – JeroldgGrob1$grobs[[15]]by the width ofgGrob1$grobs[[7]]gives the correct result. Feel free to post it as an answer so I can accept it. Many thanks! – Subsolar