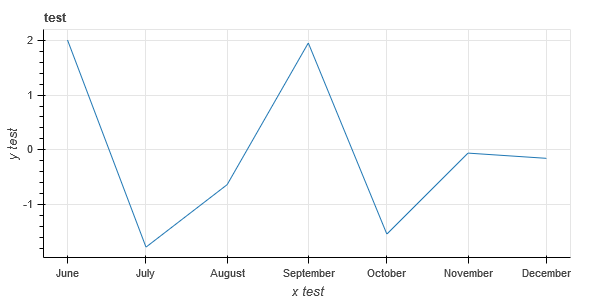
I have trouble with setting language in which datetime axis is formatted in bokeh. According to documentation, DatetimeTickFormatter produces time ticks 'according to the current locale'. However, whatever locale I set in Python, I get a plot formatted in English:
# jupyter notebook
import locale
locale.setlocale(locale.LC_ALL, 'pl')

import random
from datetime import datetime, date
from bokeh.plotting import figure, show
from bokeh.io import output_notebook
from bokeh.models.formatters import DatetimeTickFormatter

output_notebook()

x_values = [datetime(2018, i, 1) for i in range(6, 13)]
y_values = [random.normalvariate(0, 1) for i in range(6, 13)]

p = figure(plot_width=600, plot_height=300,
           x_axis_type='datetime', title="test",
           x_axis_label='x test', y_axis_label='y test')

p.line(
    x=x_values,
    y=y_values
)

p.xaxis.formatter = DatetimeTickFormatter(months = '%B')

show(p)
If that's relevant, global system locale is set to en-US:
PS C:\Users\ppatrzyk> GET-WinSystemLocale

LCID             Name             DisplayName
----             ----             -----------
1033             en-US            English (United States)
I am working with plots in multiple languages so I need to change locale on the fly. Doing that through locale.setlocale has worked fine for me with both printing dates to console and with matplotlib. How can I set it in bokeh such that dates are formatted correctly?
EDIT:
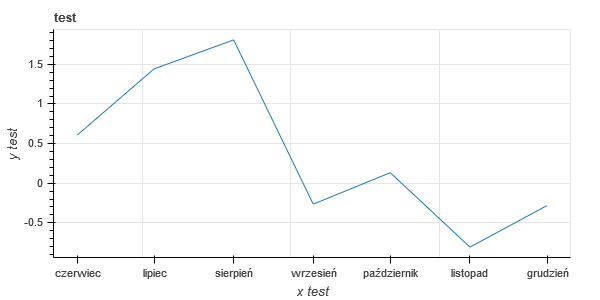
The best workaround I got is to plot dates as numeric axis (unix timestamp) and then use major_label_overrides to replace ticks with correctly formatted dates obtained from python's datetime.strftime(). However, in this case zooming to ticks in between data points is broken, so this is far from being a satisfactory solution:
x_values = [datetime(2018, i, 1) for i in range(6, 13)]
y_values = [random.normalvariate(0, 1) for i in range(6, 13)]

x_values_timestamp = [int(el.timestamp()) for el in x_values]
x_values_labels = [el.strftime('%B') for el in x_values]

p = figure(plot_width=600, plot_height=300, title="test",
           x_axis_label='x test', y_axis_label='y test')

p.xaxis.ticker = x_values_timestamp
p.xaxis.major_label_overrides = dict(zip(x_values_timestamp, x_values_labels))

p.line(
    x=x_values_timestamp,
    y=y_values
)

show(p)


