How to access the Grafana time interval range for DrillDown links to an ElasticSearch page
Asked Answered
P

2

7

I'm trying to add a drilldown link to an Elastic search link in a Grafana chart. I'm able to use the variables that are already defined in my panel, but I also want to make use of the current time interval when creating the URL for elastic search.

I have tried using the following variables in the URL based on different online posts, hoping that they would be replaced by Grafana when the URL is clicked.

  • $__interval
  • $timeInterval
  • $interval

but, nonw have been converted to the time range value that is currently selected.

e.g.: Url in Grafana:

https://elastic.local.dev/app/kibana#/discover?_g=(refreshInterval:(pause:!t,value:10000),time:(from:now-$__interval,mode:quick,to:now))&_a=(columns:!(_source),index:'logs-*',interval:auto,query:(language:lucene,query:'severity:FATAL%20AND%20%20environment:$environment'),sort:!('@timestamp',desc))

Expected Url when user clicks the chart:

https://elastic.local.dev/app/kibana#/discover?_g=(refreshInterval:(pause:!t,value:10000),time:(from:now-1h,mode:quick,to:now))&_a=(columns:!(_source),index:'logs-*',interval:auto,query:(language:lucene,query:'severity:FATAL%20AND%20%20environment:Development'),sort:!('@timestamp',desc))

Actual Url when user clicks the chart:

https://elastic.local.dev/app/kibana#/discover?_g=(refreshInterval:(pause:!t,value:10000),time:(from:now-$__interval,mode:quick,to:now))&_a=(columns:!(_source),index:'logs-*',interval:auto,query:(language:lucene,query:'severity:FATAL%20AND%20%20environment:Development'),sort:!('@timestamp',desc))

The $environment variable is being replaced as expected but the $__interval variable is not being replaced which causes the URL to not be parsed correctly by Elastic Search when trying to display the page.

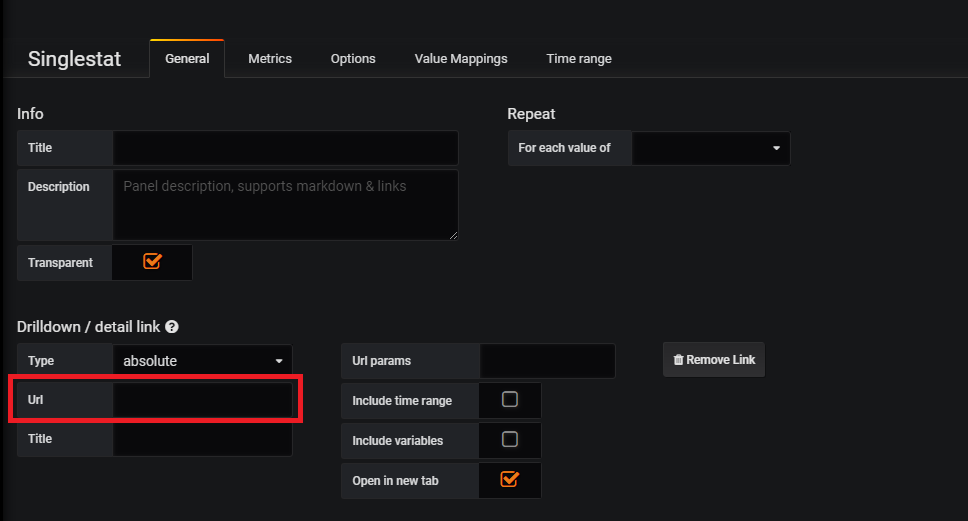
Drilldown link for SingleStat Chart

Poach answered 8/11, 2018 at 15:19 Comment(0)
M
1

Possible starting from Grafana 6.0, use this snippet:

Url: "/dashboard-id/dashboard-name?var-variable1=${__cell}&from=$__from&to=$__to

Mittel answered 31/5, 2019 at 15:7 Comment(1)
I think OP wants to link to Elasticsearch, not back to a Grafana dashboardNeither
N
0

I solved this using the absolute from and to, rather than the relative now-based time range, as follows (using your example URL):

https://elastic.local.dev/app/kibana#/discover?_g=(refreshInterval:(pause:!t,value:10000),time:(**from:'${__from:date:iso}',mode:quick,to:'${__to:date:iso}'**))&_a=(columns:!(_source),index:'logs-*',interval:auto,query:(language:lucene,query:'severity:FATAL%20AND%20%20environment:$environment'),sort:!('@timestamp',desc))

This results in a URL like this:

https://elastic.local.dev/app/kibana#/discover?_g=(refreshInterval:(pause:!t,value:10000),time:(**from:'2023-07-12T14:38:09.298Z',mode:quick,to:'2023-07-12T17:38:09.298Z'**))&_a=(columns:!(_source),index:'logs-*',interval:auto,query:(language:lucene,query:'severity:FATAL%20AND%20%20environment:Development'),sort:!('@timestamp',desc))

Note two important points:

  1. We wrap the variables in quotes, since we're formatting them as time strings rather than numeric epoch-seconds or epoch-millis
  2. We use the :iso modifier to force the format.

Can Elasticsearch accept epoch-seconds or millis in its link? Maybe. I'm not sure... but that would be another way to go.

See https://grafana.com/docs/grafana/latest/panels-visualizations/configure-data-links/#time-range-panel-variables for more info

Neither answered 12/7, 2023 at 17:42 Comment(0)

© 2022 - 2024 — McMap. All rights reserved.