How to understand the min/med/max in DAG
Asked Answered
G

1

7

I would like to fully understand the meaning of the information about min/med/max.

for example:

scan time total(min, med, max)
34m(3.1s, 10.8s, 15.1s)

means of all cores, the min scan time is 3.1s and the max is 15.1, the total time accumulated is up to 34 minutes, right?

then for

data size total (min, med, max)
8.2GB(41.5MB, 42.2MB, 43.6MB)

means of all the cores, the max usage is 43.6MB and the min usage is 41.5MB, right?

so the same logic, for the step of Sort at left, 80MB of ram has been used for each core.

Now, the executor has 4 core and 6G RAM, according to the metrix, I think a lot of RAM has been set aside, since each core could use up to around 1G RAM. So I would like to try reducing partition number and force each executor to process more data and reduce shuffle size, do you think theoretically it is possible?

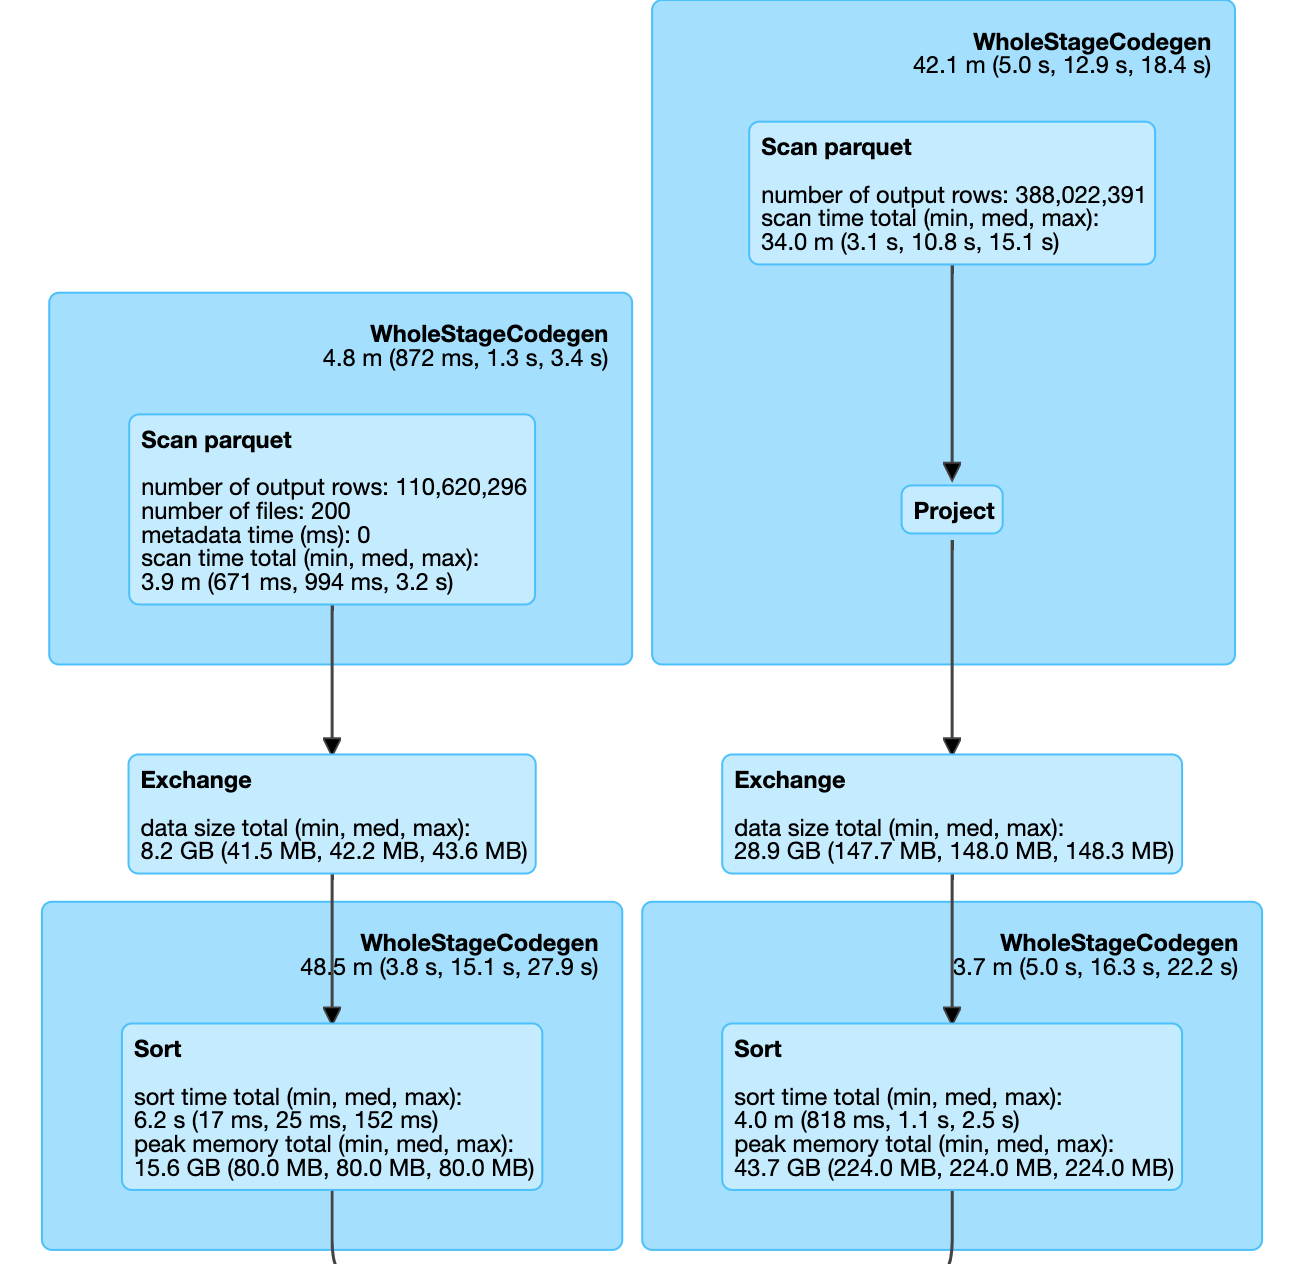
enter image description here

Gasometer answered 23/11, 2019 at 19:52 Comment(0)
S
1

The min/med/max values in the Spark UI correspond to tasks, not cores.

These metrics give insight into the performance of individual tasks within a stage. For example

scan time total(min, med, max)
34m(3.1s, 10.8s, 15.1s)
  • min : The quickest task finished in 3.1 seconds.
  • med : The median task took 10.8 seconds.
  • max : The longest task took 15.1 seconds.

Since all tasks within a stage perform the same computation, these values help identify potential issues, such as data skew, in your pipeline.

  • Data Skew Example : If the maximum value is significantly higher than the median and minimum, it indicates that some tasks are taking much longer than others. This suggests that the data might not be evenly distributed, leading to performance bottlenecks.

By understanding these metrics, you can better diagnose and address performance issues in your Spark jobs.

Stupendous answered 24/7, 2024 at 13:46 Comment(0)

© 2022 - 2025 — McMap. All rights reserved.