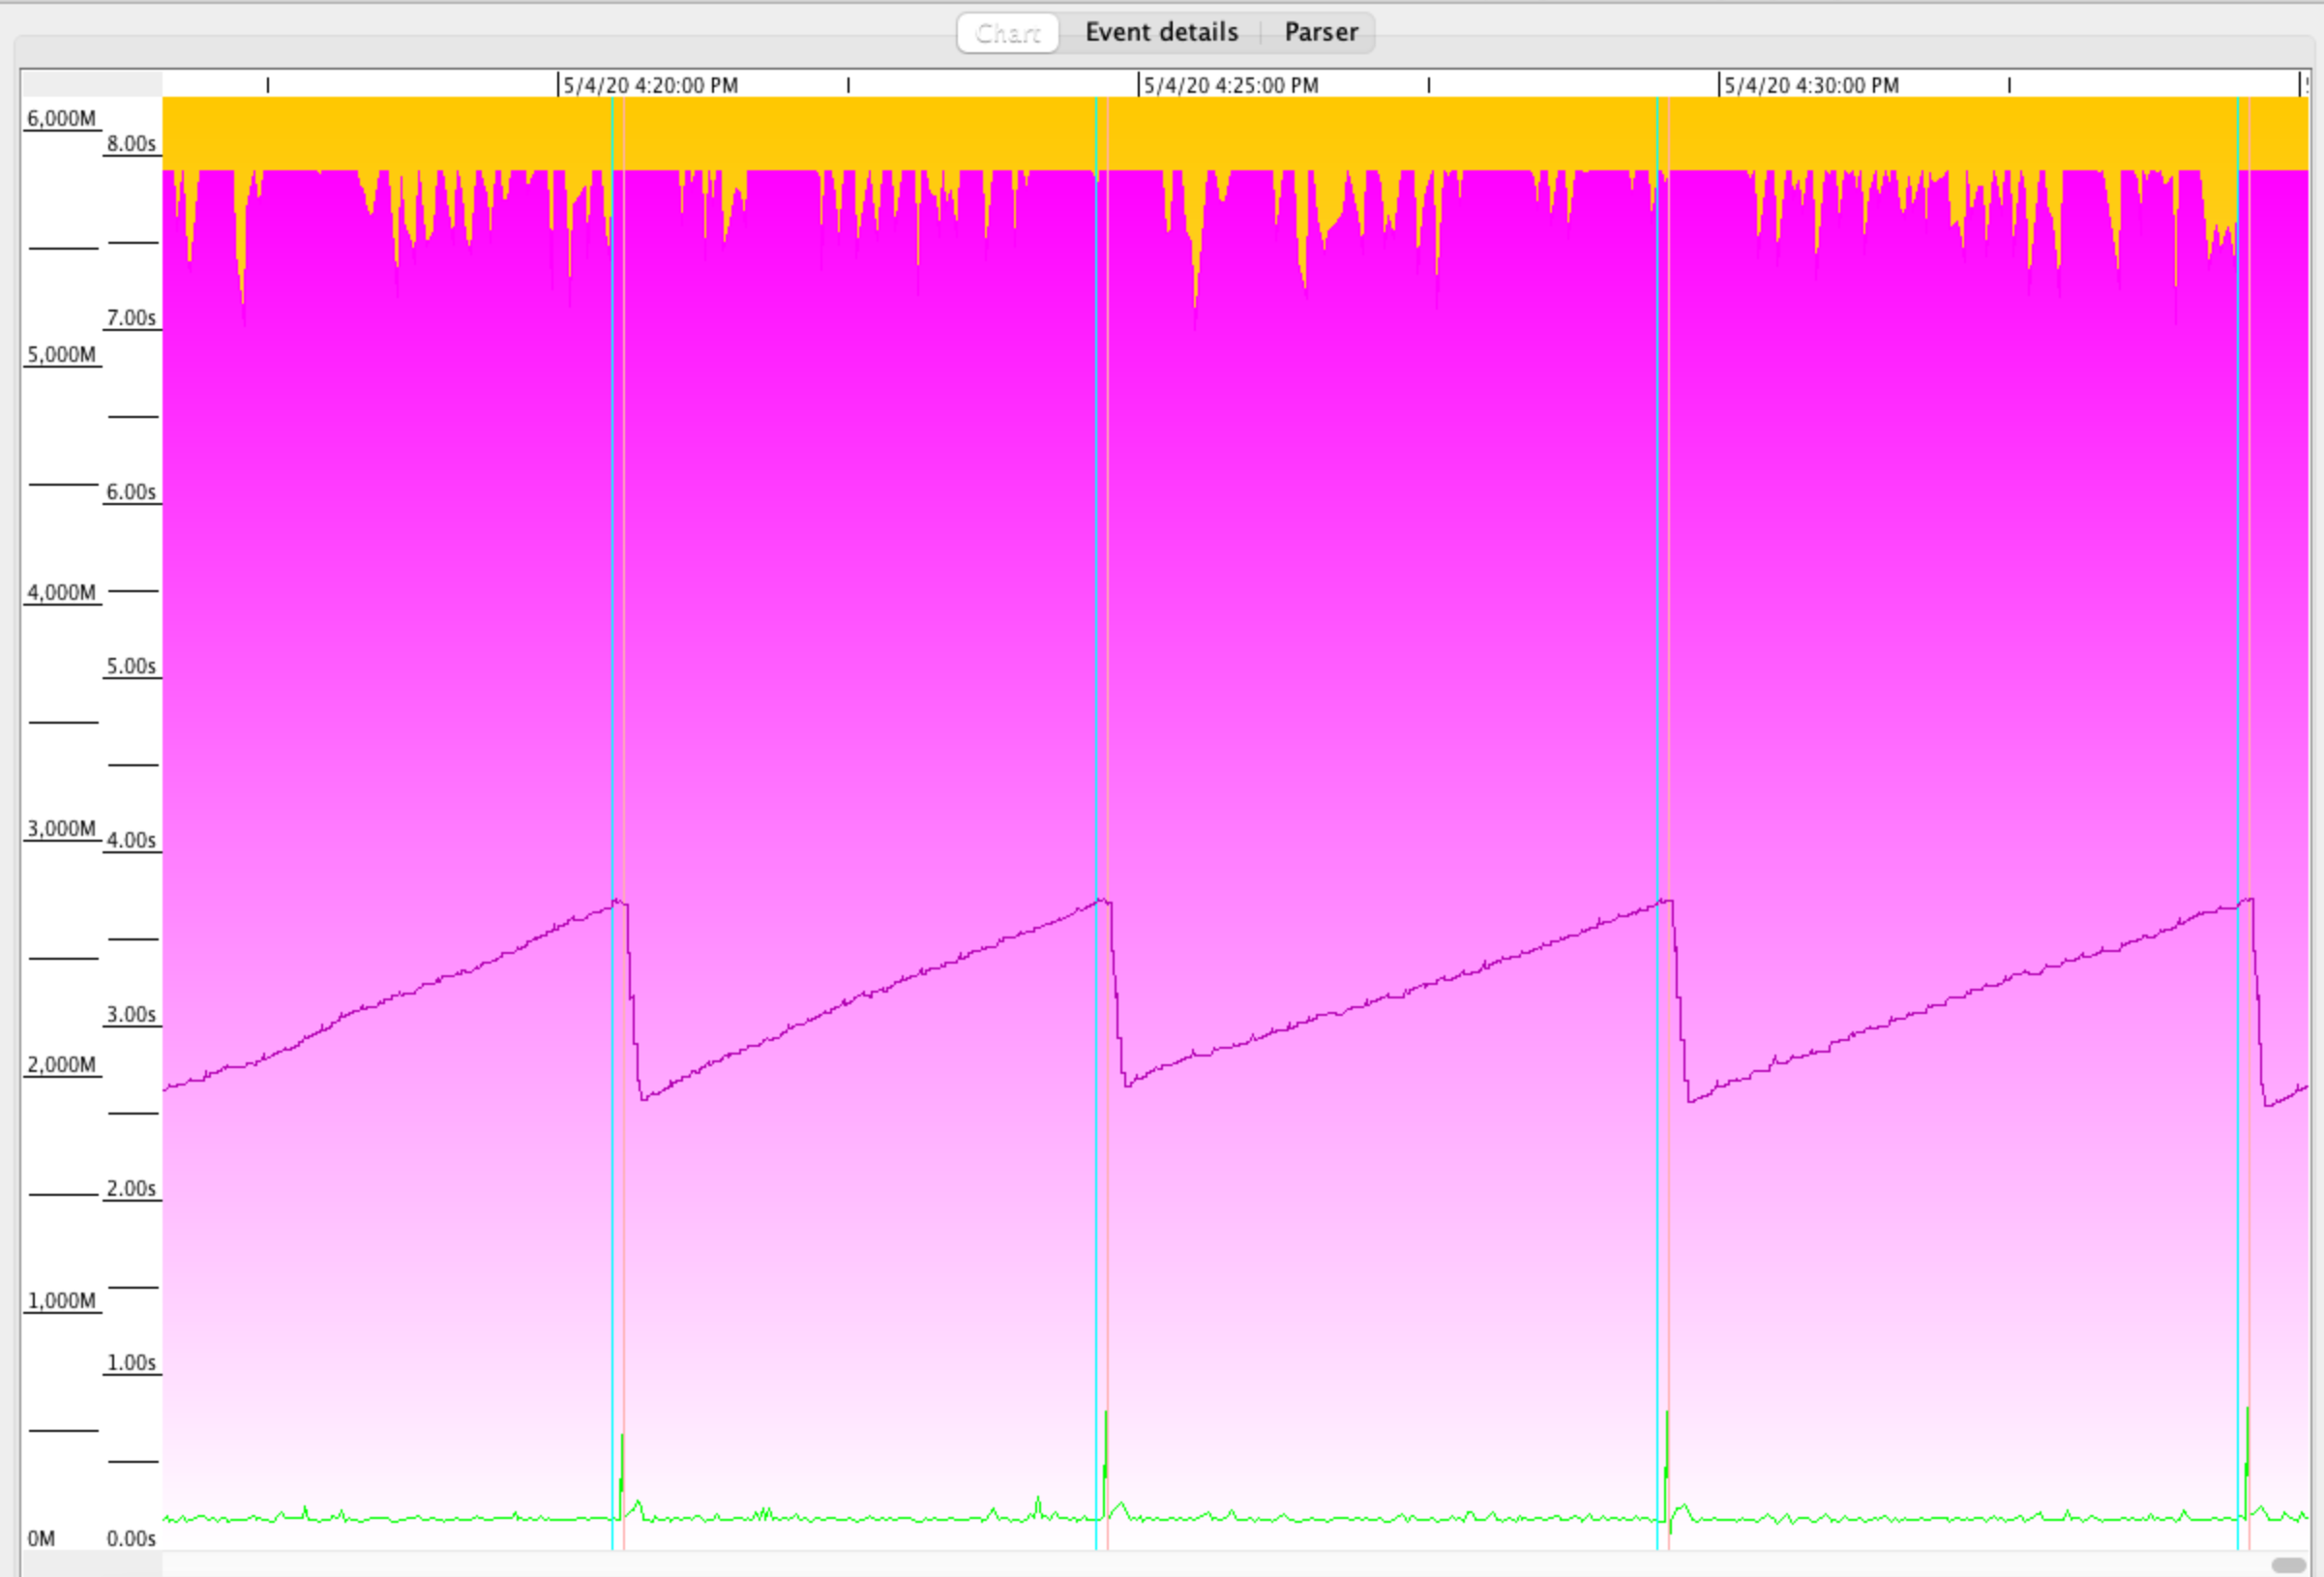
G1GC Old Gen committed heap keeps growing, used is constant - leads to Eden starvation
Asked Answered
T

2

7

The G1GC old generation committed heap goes up over time (about 5 to 6 days on production) but the old generation used heap does not. The Eden and survivor heap is forced to decrease to the minimum (5% of the total heap) and so garbage collection because more and more frequent. The application caches one big object graph right at the beginning and then has other time/use limited caching throughout its run lifetime. It has a fairly high object creation rate but does not promote much of that to the old generation apart from the cached objects.

I have run the GC log through gceasy.io and you can see the above behaviour of the memory: https://gceasy.io/my-gc-report.jsp?p=c2hhcmVkLzIwMjAvMDUvMTEvLS1nY2xvZy50YXIuZ3otLTExLTMwLTE5&channel=WEB.

gclog: https://drive.google.com/open?id=176X-Lku4D3DGCCdTiB0_z545N8n0tfKc

Grafana memory metrics for this run https://snapshot.raintank.io/dashboard/snapshot/k6g3ljG7cQUEJM7jA4c5tBK1dsUnzabd

Heap dump at end of run (load had been removed for about an hour, this is a 500M gz file): https://drive.google.com/open?id=14ghzIVnpelInSyQBhCwUwM5VkuOjX13-

We do not seem to have high humongous object creation. The server has 12G of RAM and the heap has 6G.

The jvm:

openjdk version "1.8.0_242"
OpenJDK Runtime Environment (AdoptOpenJDK)(build 1.8.0_242-b08)
OpenJDK 64-Bit Server VM (AdoptOpenJDK)(build 25.242-b08, mixed mode)

The jvm flags:

-XX:CICompilerCount=4
-XX:ConcGCThreads=2
-XX:G1HeapRegionSize=2097152
-XX:GCLogFileSize=104857600
-XX:InitialHeapSize=6442450944
-XX:InitialRAMPercentage=50.000000
-XX:+ManagementServer
-XX:MarkStackSize=4194304
-XX:MaxHeapSize=6442450944
-XX:MaxNewSize=3865051136
-XX:MaxRAMPercentage=50.000000
-XX:MinHeapDeltaBytes=2097152
-XX:MinRAMPercentage=50.000000
-XX:NumberOfGCLogFiles=10
-XX:+PrintGC
-XX:+PrintGCDateStamps
-XX:+PrintGCDetails
-XX:+PrintGCTimeStamps
-XX:+UseCompressedClassPointers
-XX:+UseCompressedOops
-XX:+UseG1GC
-XX:+UseGCLogFileRotation

We run on openshift with CentOS: CentOS Linux release 7.7.1908 (Core)

Kernel: 3.10.0-1062.12.1.el7.x86_64

Terbecki answered 11/5, 2020 at 12:51 Comment(3)
Have you tried to take a heap dump and analyze early in the run, and then after a few days, and compare?Goatskin
I have tried that and see nothing special, in particular the actual used heap is always much much lower than the committed heap. I have a heap dump for the end of this run and it shows 1.3G total heap usage and yet the old generation has committed close to 6G (I will upload a link). Hence the eden is starved. I have uploaded a grafana metrics link to show memory usage similar to what gceasy shows.Terbecki
@TomDearman I got the same problem (commited ~ 2 * used), did you find what was the root cause ? When I have a small eden+survivor committed space, a big part of the cpu usage will be used by the gc and the whole application will be slowed down even if I have enough memoryDextran
N
1

From your GC log, below is how it looks from GCViewer

The GC Log show that Ref Proc is the bottle neck of High GC Time So suggest try -XX:+ParallelRefProcEnabled to see if it can help

  [Ref Proc: 151.3 ms]
  [Ref Proc: 147.2 ms]
  [Ref Proc: 146.6 ms]
  [Ref Proc: 183.0 ms]
  [Ref Proc: 156.4 ms]
  [Ref Proc: 152.7 ms]
  [Ref Proc: 143.7 ms]
  [Ref Proc: 137.8 ms]
  [Ref Proc: 194.8 ms]
  [Ref Proc: 153.3 ms]
  [Ref Proc: 153.6 ms]

There are some other several things could have a try to improve:

  1. Turn on -XX:PrintReferenceGC to get more detail time spend on Ref Proc
  2. Reduce -XX:InitiatingHeapOccupancyPercent(default is 45) gradually to see if Mixed GC could happen earlier and help on the behavior
  3. Increase -XX:G1NewSizePercent to avoid the Young Generation to reduce too small

Hope can help on it

GC Viewer UI

Natie answered 29/4, 2022 at 16:14 Comment(0)
W
0

In general, it is normal that committed memory value is higher than used. Committed starts with -Xms and can go up to -Xmx, but committed is not resident. Resident here means in RAM, while used = resident + swapped pages. So used can fluctuate a lot, while committed not that much, at least, this is how I understand this.

A GC starts with the value of -Xms as the initial committed memory and will slowly grow (up to -Xmx of course). And now that I have made this intro, I really don't think this makes any sense to your application. Let me explain.

As far as I can see from the logs that you provided, everything is pretty much expected (and normal). G1 has a default value for MaxGCPauseMillis = 200ms which indicates how much your application is allowed to be stopped (in the happy path scenario). According to this value, G1 makes proper decisions to re-size your regions. According to your logs, the Eden space of around 270MB (on average) is collected in up to 0.2s. Just a random example from your logs:

[Eden: 280.0M ....
Times: user=0.49 sys=0.00, real=0.18 secs
2020-05-04T02:43:01.742+0000: 315128.451: [GC pause (G1 Evacuation Pause) (young), 0.1740299 secs]

So this is exactly what you asked for, indirectly. To me, your application is perfectly fine, those GC pause (G1 Evacuation Pause) take as much as you have configured. And btw, call yourself lucky? but in that entire log file there is not a single Full GC that I can spot (apart from the one when you take the heap dump).

Worldlywise answered 9/7, 2020 at 2:52 Comment(0)

© 2022 - 2024 — McMap. All rights reserved.