I'm running my large, public-facing web-application. It's a python HTTP back-end server that responds to thousands of HTTP requests per minute. It is written with Flask & SQLAlchemy. The application running on an EC2 in AWS. The instance type is c3.2xlarge (it has 8 CPUs).
I'm using Gunicorn as my webserver. Gunicorn has 17 worker processes and 1 master process. Below you can see the 17 gunicorn workers:
$ sudo ps -aefF | grep gunicorn | grep worker | wc -l
17

$ sudo ps -aefF --sort -rss | grep gunicorn | grep worker
UID       PID  PPID  C      SZ     RSS PSR STIME TTY     TIME                           CMD
my-user 15708 26468  6 1000306 3648504   1 Oct06   ? 08:46:19 gunicorn: worker [my-service]
my-user 23004 26468  1  320150  927524   0 Oct07   ? 02:07:55 gunicorn: worker [my-service]
my-user 26564 26468  0  273339  740200   3 Oct04   ? 01:43:20 gunicorn: worker [my-service]
my-user 26562 26468  0  135113  260468   4 Oct04   ? 00:29:40 gunicorn: worker [my-service]
my-user 26558 26468  0  109946  159696   7 Oct04   ? 00:15:14 gunicorn: worker [my-service]
my-user 26556 26468  0  125294  148180   6 Oct04   ? 00:13:07 gunicorn: worker [my-service]
my-user 26554 26468  0  120434  128016   5 Oct04   ? 00:10:13 gunicorn: worker [my-service]
my-user 26552 26468  0   99233  116832   5 Oct04   ? 00:08:24 gunicorn: worker [my-service]
my-user 26550 26468  0   94334   96784   0 Oct04   ? 00:05:28 gunicorn: worker [my-service]
my-user 26548 26468  0   92865   90512   2 Oct04   ? 00:04:47 gunicorn: worker [my-service]
my-user 27887 26468  1   91945   86564   0 17:44   ? 00:02:57 gunicorn: worker [my-service]
my-user 26546 26468  0  127841   84464   5 Oct04   ? 00:03:39 gunicorn: worker [my-service]
my-user 26544 26468  0   90290   80736   2 Oct04   ? 00:03:12 gunicorn: worker [my-service]
my-user 26540 26468  0  107669   78176   5 Oct04   ? 00:02:33 gunicorn: worker [my-service]
my-user 26542 26468  0   89446   76616   5 Oct04   ? 00:02:49 gunicorn: worker [my-service]
my-user 26538 26468  0   88056   72028   5 Oct04   ? 00:02:02 gunicorn: worker [my-service]
my-user 26510 26468  0  106046   70836   2 Oct04   ? 00:01:49 gunicorn: worker [my-service]
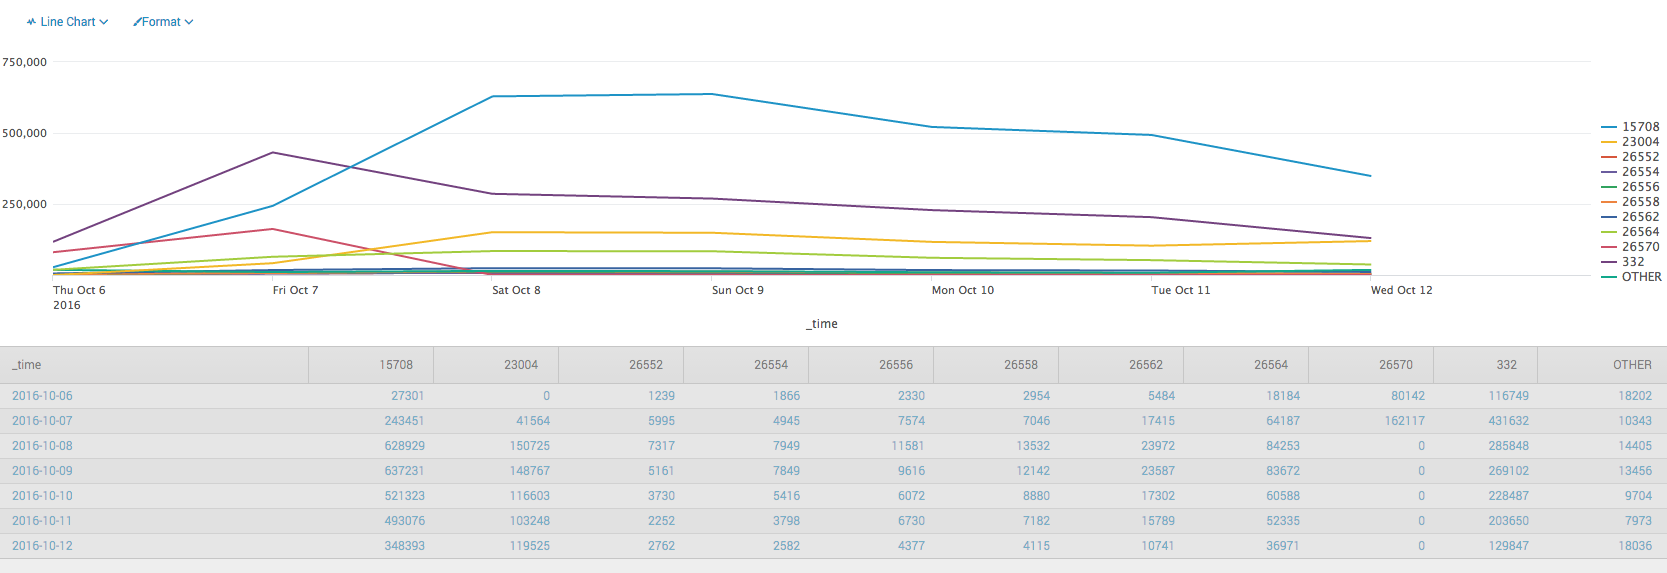
I'm examining logs of all the HTTP requests that came in over the past 7 days. I have grouped and summed the requests by the Process ID which you can see in me ps command above. Below you can see the resultant graph.
As you can see, 5 gunicorn workers are doing almost 100% of the work. The remaining 12 are basically idle. And out of those 5, one worker (PID #15708) is doing by far the most work.
Why is this happening? I would like to understand the algorithm that gunicorn uses to distribute the work amongst its workers. It's definitely not round-robin? Where can I see the strategy it uses and how can I tweak it? What might explain the rises and falls in this graph? (For example PID #332 was doing the most work until October 7th when it started declining and was overtaken by rising PID #15708)
A clear explanation would be helpful and/or links to relevant documentation.


gevent_pywsgi. – Overtrick